The Fed minutes for their June 14-15 meeting were released today, and they explained why the Fed took such aggressive action on interest rates:
“The near-term inflation outlook had deteriorated since the time of the May meeting,” the minutes said. “Participants were concerned that the May CPI release indicated that inflation pressures had yet to show signs of abating, and a number of them saw it as solidifying the view that inflation would be more persistent than they had previously anticipated.”
This was all because four days earlier the BLS announced that CPI had clocked in at 8.6% in May. This was splashed across front pages everywhere as "the biggest increase since 1981."
But guess what? The media freakout was based on a CPI figure of 8.58% compared to 8.54% two months earlier. Some record. And that was for headline CPI using the non-seasonally adjusted figures. Using the more normal seasonally-adjusted figure, it wasn't a record at all. (March was.) And using the even more relevant core CPI figures, May represented the second month in a row of declining inflation.
And of course that's CPI, which the Fed claims not to care much about. They care about the core PCE rate. At the time of their meeting, the core year-over-year PCE rate had declined since February from 5.3% to 5.2% to 4.9%. And although they didn't know it, a few days later it would decline again to 4.7%.
And then there's the momentum of the month-over-month rate, which looked like this:
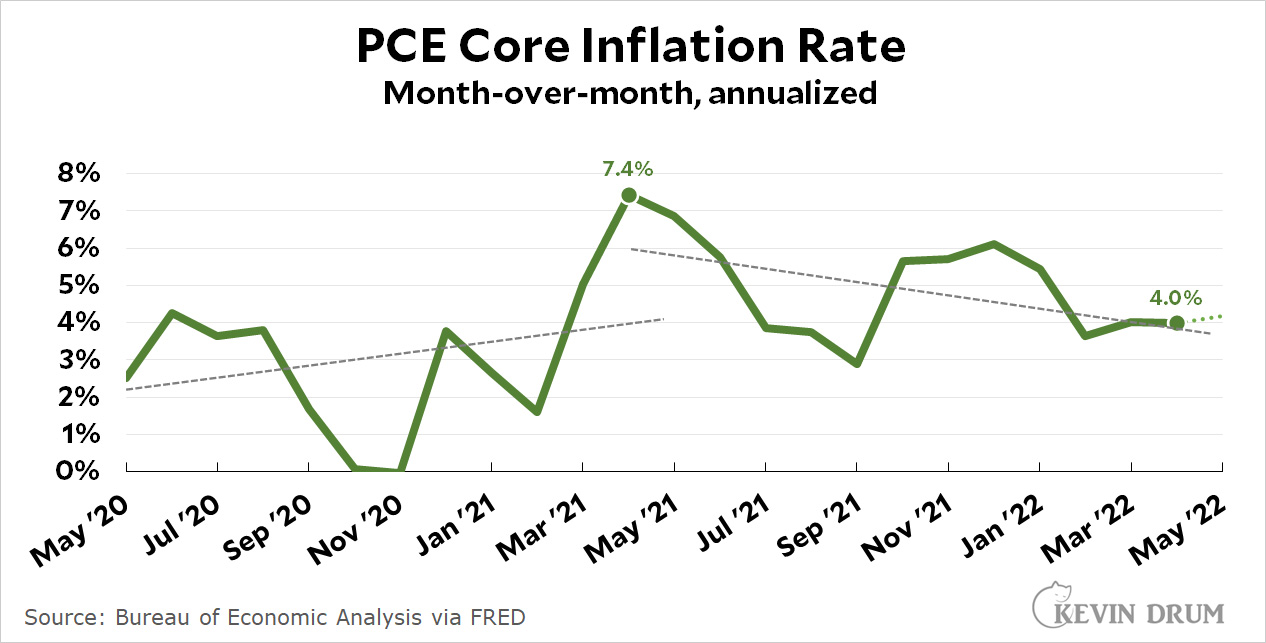 The April figures were the latest the Fed had available at their meeting, but the trend was clear regardless: since its peak a year ago it had been dropping steadily, going from 7.4% to 4.0%. That's a big and sustained downward movement.¹
You can always find something worrisome if you look hard enough. But there's a whole lot of evidence that inflationary pressures are abating. You have to look pretty hard to find something contradictory—like, say, a single month of headline, non-seasonally-adjusted CPI. The stuff that counts—trends, core inflation, PCE—all show declines.
IANAE and I might be all wet on this. But the evidence sure looks awfully clear to me. Just about every relevant measure is showing some welcome softening in inflation. And looking beyond the core, gasoline is now in its third week of declining prices (down yet another ten cents last week). This leaves food as our biggest remaining problem, but that's largely due to bad crops, war in Ukraine, and natural gas prices causing a big spike last year in fertilizer costs (but which have been softening since March). That will all work itself out eventually, and in the meantime there's nothing the Fed can do to speed it along.
¹When the May result was released it came in at 4.2%. But this is a volatile measurement and a small change in a single month doesn't mean much.
Oil is down because of recession fears. But if price of oil drops, then inflation, as people encounter it, drops. If inflation drops, then the Fed doesn't have to raise rates. IF the Fed doesn't raise rates, then recession fears drop. If fear of recession gone, oil prices spike....
There's a hole in my bucket....
Why would oil prices spike if people fear recession less? There are spans of years when recession fears and oil prices are simultaneously low.
No recession coming? Let's build factories and warehouses and stores and houses and stuff! That's where the fuel demand comes in, I imagine.
Pogoing it's sometimes called, and very hard to model for all but the simplest systems. Like, say, the old dropping a golf ball in sombody's gas tank bit of mischief.
Perhaps you are correct and inflation is about to abate. However, the smart money still holds that the Fed will continue to increase interest rates....
Of course they will. There’s an election coming up that needs skewing to the right as much as possible.
Still making the same mistake in choosing an arbitrary point at April 2021 simply because it's the big spike, which is impacting the analysis of the time periods before and after then.
I still see this chart and think "inflation (which is a long term, longer time horizon thing) is slowly creeping up and there happened to be a couple of bigger spikes that were painful."
That is also how I read Kevin’s picked cherries. Draw a trend line through the entire chart and you arrive at a conclusion very different from Kevin’s.
The last time Kevin posted that chart, I put the data into a spreadsheet and created a single linear trendline.
It was an upward slope.
f(m) = 0.13 m + 2.1, with R-squared of .22
Kevin *chooses* to plot two linear trendlines.
But why stop there? If you create seven linear trendlines, the last one (encompassing three data points) you get
f(m) = 0.3 m + 3.2 with R-squared of 0.87
That's inflation rising 0.3% each month. Kevin should alert us to this very worrisome trend.
Yeah, I’m always skeptical of assumptions of discontinuity. My inclination is to compare the goodness of a linear to a quadratic fit, which could indicate a change in trend without assuming one first.
Is it really arbitrary ? Let's step back a minute and ask, why has inflation gone up recently ? If we assume it has something with the global pandemic (which initially caused inflation to go down) and the large amount of money that was poured in both in 2020 and 2021 by the federal government and that it has been exacerbated by supply chain issues also a result of the pandemic, then positing that we should see some sign of this abating seems reasonable and Kevin's choice of trend also seems reasonable.
I think what's obvious is that there's still an upward trend in the graph, but that it's slowing down. The big spikes (temporary shocks) mask/confuse/confound what's actually going on (slight inflationary pressure that's still increasing, but increasing more slowly and will probably ease soon).
Basically, I come to the same conclusion (that inflation pressure will ease up), but for different reasons that aren't hand-wavy and arbitrary. It takes a long time for those big amounts of deficit spending to fully percolate through the economy, but it will fade (and is doing so).
I actually think the Fed would be taking the right course to not raise interest rates any more than they already have. I think they're already in danger of over-correcting.
"Still making the same mistake .."
Yes, the inflation graph is just as bogus as the first time Drum posted it. Perhaps we should get Andrew Gelman on the case.
Yeah, it's no good to draw a trend line starting at that way-high peak. It has come down, but the Fed isn't happy to have it at 4% either. I still think it would have kept coming down even if they hadn't leapt at the 3/4-point hike, but they could still lighten up next time.
ARIMA is your friend on this one. There are other tools in the toolbox, but it's been my experience ARIMA is the one most people try first.
I will pretend I'm a social scientist. I will note that an important variable I can measure held approximately steady for quite a few years, and then suddenly went up quite a lot, and persisted at that elevated level for at least a significant number of months. Being a scientist with a mathematical bent, I like to give my variables mathematical names, so I shall assign that measurable variable of interest the name of "X."
Now, I know that there are several factors that are allegedly related to variations in the important variable I am concerned about. Two, in particular, are somewhat under control of the government. I'll call them "Y" and "Z." When I observe the behavior of Y and Z over a long time, I see that both Y and Z were pretty constant over a long time, and then Y continued to hold steady, while Z took a sudden and dramatic turn upward.
I find it most interesting that my variable of interest took its sharp upward turn very soon after my factor Z took its upward turn, while my factor Y stayed constant through it all. So I theorize that some folks in government, wanting to hold the variable X within an "acceptable range," would naturally try to get that factor Z under control. Much to my surprise, however, all those government officials, as well as all the so-called scientists with the discipline, go gaga over factor Y, and with much hand wringing and gnashing of teeth, they debate how much they can vary Y to control X.
For anybody who has had the patience to read this far, I hope my X, Y, and Z are apparent. X, of course, is inflation, while Y is the interest rate and Z is fiscal policy. Inflation came upon us as surely as day follows night when the government infused a huge slug of fiscal stimulus. So naturally, what did all those economists do to combat it. Well, of course, they raised interest.
When your only tool is a hammer, you tend to see every problem as a nail.
I actually am a social scientist. When one notices that a pair of variables, say X and Z seem to covary, i.e. rise and/or fall together, one must always bear in mind that, while one might be the cause of change in the other, it is also possible that neither is causative; rather, another factor, perhaps not observed or measured, is the cause of change in both. Say, for instance, a pandemic disease sickens a lot of workers and idles many more, constraining supply and leading to higher prices. Responding to the economic impact, governments quickly spend heavily on relief to support workers who have lost some or all of their income.
It is also possible that X and Z aren't atomic variables and what you see is the reflection of the interactions of more fundamental entities, ones that you may see but not recognize, or something you know has to be there but for various reasons are currently unobservable. And BTW, is your last sentence:
is an example of which variable? X or Y or Z? Apologies for the snark, if snark it be.
Z, which Ken Rhodes identified with fiscal policy. I just said ‘spending’; we all recognize that the ‘impact’ payouts were financed by borrowing, which together make for expansionary fiscal policy.
Well, your fable had some truth to it up to a certain point. But it just so happens that in the real world, economists know very well the salience of fiscal policy, and in fact go to some lengths to make the public aware of it; Paul Krugman doing his bit a the BYT is my usual go-to example. However, they also know that fiscal policy is a nonstarter with the R's and what they say goes for now, or rather, doesn't.
Hence trying to figure out how to use lady Y to the best effect.
But thanks to the budget reconciliation exemption from filibuster, Democrats were able to adopt an expansionary fiscal policy in response to the economic disruption of the pandemic. Now that inflation is an issue, the Keynesian response would be contractionary policy, either as reduced government spending, or higher taxes. Neither party wants to raise taxes in an election year. Republicans would be fine with cutting spending, Democrats would not.
FWIW, 5-year breakeven inflation rate -- https://fred.stlouisfed.org/series/T5YIE -- shows (market) inflation expectations peaked in March 2022. Also, the 0.125% 5-year TIPS -- https://fred.stlouisfed.org/series/DTP5A25 -- which hit maturity in April 2025, reflects significantly lower (market) inflation expectations.
The problem is, and always will be, that headline inflation is what people respond to, politically, when it comes to the UM survey and how they vote.
It's really difficult to move the needle on supply/demand for gasoline when it comes to prices, and often when politicians act, they do so, ironically. The fastest means is to get people to stop driving to work. It's no wonder people want to continue to WFH. At the same time, however, we could immediately slash vehicle miles driven by simply subsidizing public transportation to make it free (for the rest of 2022), particularly in the most congested cities.
Is the thing holding back transit use “today” actually fares, or is it sharing a confined space with likely poor ventilation with twenty to forty-odd people whom you don’t know, for upwards of an hour each way, twice a day and five days a week?
That's why we have masks, isn't it?
And said masks are not absolute protection. Simply improving the odds.
Today, that is what keeps me from public transit rather than fares.
Yet, people are throwing tons of money at airlines to crowd into “confined spaces” with hundreds of maskless strangers for generally longer periods of time (few one way commutes are longer than 2 hours, even on slow transit vehicles).
It’s not fares, crowding or (probably*) the filtration systems. It’s pure classism. People are afraid to sit next to the poors on transit because they’re perceived as vectors of disease more readily than middle class and rich people.
*I honestly don’t think the type of people who threw away their masks at the first opportunity are doing comparative analysis of filtration systems before deciding to go into any enclosed environment, but YMMV I guess.
And even pre-pandemic, most places do not have good public transit systems. Buses will stop before your shift ends, only run every hour, end up taking way too long, etc.
????????????????
Unless you're in a very densely populated area, mass transit won't ever overtake car use for commuting. And when you get to the bigger states this is especially true.
Is it really arbitrary ? Let's step back a minute and ask, why has inflation gone up recently ? If we assume it has something with the global pandemic (which initially caused inflation to go down) and the large amount of money that was poured in both in 2020 and 2021 by the federal government and that it has been exacerbated by supply chain issues also a result of the pandemic, then positing that we should see some sign of this abating seems reasonable and Kevin's choice of trend also seems reasonable.
In 9 of the last 10 years, the gasoline supply has only seasonally fluctuated ~19% while the monthly variation in 9 of the last 10 years has been ~7% (EIA). This isn't an expectation that everyone will jump onto public transit, but less than 10% would be sufficient to dramatically reduce gasoline demand.
According to NHTS (2017), the average work commute is 15 miles daily. The Census ACS (2021) points to an average one-way commute time was 27 minutes, and using public transportation added just 20 more minutes to that national average. At a national average of 23 mpg fuel efficiency for all light vehicles on the road, NTS (2020), people affected by inflation at the grocery store could offset their wallet by free public transportation but cutting $15-20 a week in gasoline use. Not a lot of people will be attracted to this, but again, we don't need a lot of people to sign up for free public transportation.
Point is, give people the economic choice. IDK why you would want to summarily cut off Americans from making this economic choice for themselves.
(this is in response to ppl who don't think free public transportation is worth it, as a response to headline inflation)
This makes total sense. So, for stock buying purposes, when does the fever break? Which report on what day sets the media to squawking about "covid inflation" being over?
Trend lines are always time bound. Do you think that using a 10 year graph is more useful than using just the last year ? If so, why ?
And let's remember that for over a decade the inflation hawks have been predicting disaster. Unsurprisingly eventually they were right. Of course it took a global pandemic and the vigorous response of government to prevent even worse outcomes for the least of us to finally bring it about. And now Kevin is rightly pointing out that we should probably start ignoring the back to the 70' inflation hawks again. Or at least suggest that they moderate their sky is falling shrieking.
Does anyone want to bet against core inflation going down over the next year ?
https://tradingeconomics.com/united-states/core-inflation-rate#:~:text=Core%20Inflation%20Rate%20in%20the%20United%20States%20averaged%203.59%20percent,percent%20in%20May%20of%201957.
https://tradingeconomics.com/united-states/core-inflation-rate#:~:text=Core%20Inflation%20Rate%20in%20the%20United%20States%20averaged%203.59%20percent,percent%20in%20May%20of%201957.
"But the preferences of developed, aging polities — first Japan, now the United States and Europe — are obvious to a dispassionate observer. Their overwhelming priority is to protect the purchasing power of incumbent creditors. That’s it. That’s everything. All other considerations are secondary. These preferences are reflected in what the polities do, how they behave. They swoop in with incredible speed and force to bail out the financial sectors in which creditors are invested, trampling over prior norms and laws as necessary. The same preferences are reflected in what the polities omit to do. They do not pursue monetary policy with sufficient force to ensure expenditure growth even at risk of inflation. They do not pursue fiscal policy with sufficient force to ensure employment even at risk of inflation. They remain forever vigilant that neither monetary ease nor fiscal profligacy engender inflation. The tepid policy experiments that are occasionally embarked upon they sabotage at the very first hint of inflation. The purchasing power of holders of nominal debt must not be put at risk. That is the overriding preference, in context of which observed behavior is rational."
-Steve Randy Waldman
Spot on.
This is "I will kill the hostages if you don't agree to my demands" bargaining going on here. The threat of killing the economy is meant to prevent elevated inflation expectations from settling in, but it also looks preposterous on its face.
Gas dropped 10 cents at SOME gas stations in my area 3 weeks ago to $4.70. Since then nothing and several gas stations are still at $4.80 with no change. So gas prices have no been dropping for me.
BTW, can anyone tell me where Kevin is getting the figures for his chart? I assumed that it was from some source like BLS, but I can't find the info there. Maybe I suck at navigating through goverment sites. Then again, maybe the site is just has a sucky UX.
FRED
https://fred.stlouisfed.org/series/PCEPILFE#0
Just above the graph are widgets to set the date range, and the edit button lets you change the y-axis to percent change, and to multiply by twelve to annualize.
Thanks. This is exactly backwards WRT my own work flow, but I get it now.
https://www.cnbc.com/amp/2022/07/13/inflation-rose-9point1percent-in-june-even-more-than-expected-as-price-pressures-intensify.html