Skip to content

I'm not a big fan of formal French gardens, but if you're going to see one I suppose Versailles is the pinnacle of the art. When we were there the famous fountains weren't running because they only operate them on weekends. I don't get that. Sure, back in the day they were an engineering marvel, but now they're just ordinary fountains operated by ordinary electric pumps. Why not run them all the time?

May 25, 2022— Versailles, France

It looks like the Atlanta Fed's forecasting prowess was pretty good for second quarter GDP:

Real GDP declined 0.9% on an annualized basis, so we now have two consecutive quarters of contraction. On the bright side, real GDP was up 1.6% compared to a year earlier.

Down in the details, none of this can be blamed on the brave American consumer, who increased spending by 1% in the second quarter. At the same time, corporations cut their investment level by 13.5%, mostly due to reduced construction, and government consumption was down 1.9%, the third consecutive quarter of declining government spending.

And now let the battle begin: Are we in a recession? I still vote no.

So how is Russia doing these days? Tyler Cowen points us to a paper from the Yale School of Management that says the Russian economy is in terrible shape:

Our team of experts, using private Russian language and unconventional data sources including high frequency consumer data, cross-channel checks, releases from Russia’s international trade partners, and data mining of complex shipping data, have released one of the first comprehensive economic analyses measuring Russian current economic activity five months into the invasion, and assessing Russia’s economic outlook.

From our analysis, it becomes clear: business retreats and sanctions are catastrophically crippling the Russian economy.

Among many, many other things, the authors say that consumer spending is down about 20%; auto sales have collapsed; industrial production has been cut back across the board thanks to sanctions that prevent the import of crucial components; inflation is running at nearly 20%; and Russian oil is selling at a huge discount. Naturally you'd like to see all this in charts. Here you go:

Interesting times:

  • The Senate has passed the $280 billion chips bill and the House will soon follow. Keep in mind that it's actually about $80 billion for chips and $200 billion to fund 20 "regional technology hubs" for general research into artificial intelligence, robotics, quantum computing and other cool-sounding futuristic stuff. Also keep in mind that this spending stretches over ten years, so it's really only about $30 billion per year, about half a percent of the federal budget.
  • Joe Manchin has finally reached an agreement for a bill with three components: about $400 billion in spending on climate change; a mandate for Medicare to start negotiating prescription drug prices; and about $700 billion in new taxes. Details to come.
  • We seem to be close to a bipartisan agreement to pass the Electoral Count Reform Act. It's not a comprehensive election bill, but it's a good step forward. Rick Hasen explains: "It not only would confirm what we’ve already known—that a vice president has no unilateral power to accept or reject election results. It would also raise the threshold for senators or representatives to object to valid electoral college votes, eliminate the chance that a state legislature could rely on that 'failed election' language to send in alternative slate of electors, and provide a mechanism for federal judicial review of any action by a rogue governor to send in a fake slate of electors. These are all positive developments."
  • The Fed raised short-term interest rates another three-quarters of a point today. Idiots.
  • A bill to codify same-sex marriage nationwide—just in case the Supreme Court gets itchy to overturn Obergefell—got a surprising amount of Republican support in last week's House vote. Now there's some optimism that it could get ten Republican votes in the Senate, enough to overcome to a filibuster. I remain pessimistic about this, but you never know. I suspect that most Republicans, even if they won't say so publicly, don't really oppose same-sex marriage anymore, having seen that nothing much has happened over the past seven years since it became legal nationwide.

It's almost as if a sudden desire to actually do stuff has broken out in Washington DC. Amazing.

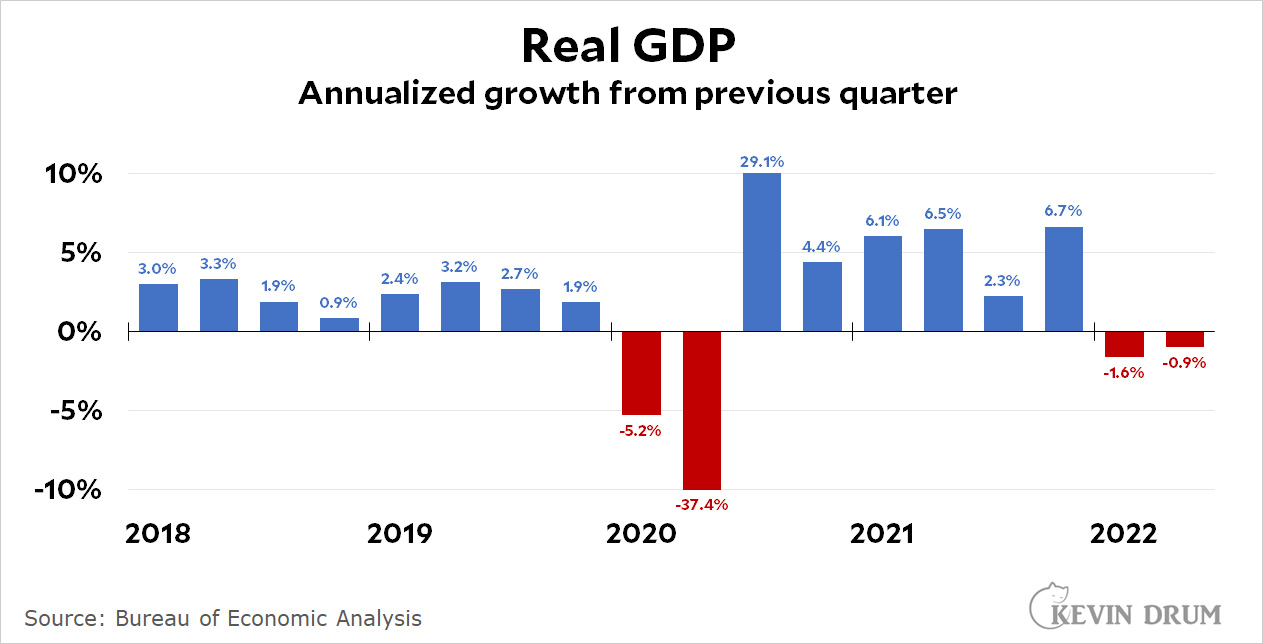
Tomorrow is a big day: the BEA will announce GDP for the second quarter and then we can all spend the rest of the day arguing about whether we're in a recession. Here's the forecast from the Atlanta Fed:

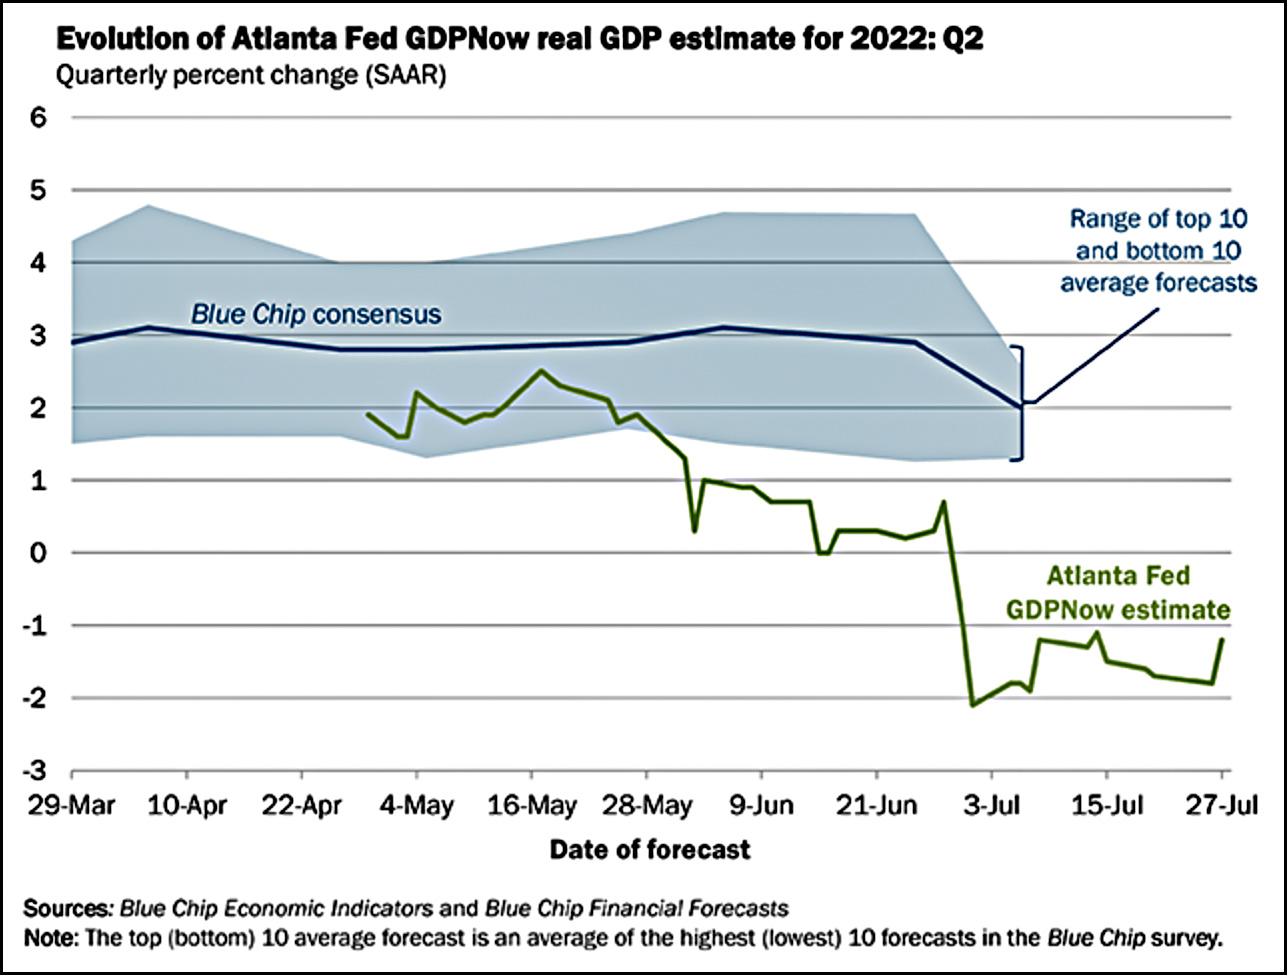
This will be a good test of the Atlanta Fed's GDPNow algorithms. They predict that GDP will come in at -1.2%, while the consensus of blue-chip forecasters puts it at +2%. That's quite a spread. Of course, the blue-chip forecast only goes through July 3, and it's gotten more pessimistic since then. The Conference Board is currently at +0.8%. The rest of the blue-chip gang is apparently at about +0.4%.

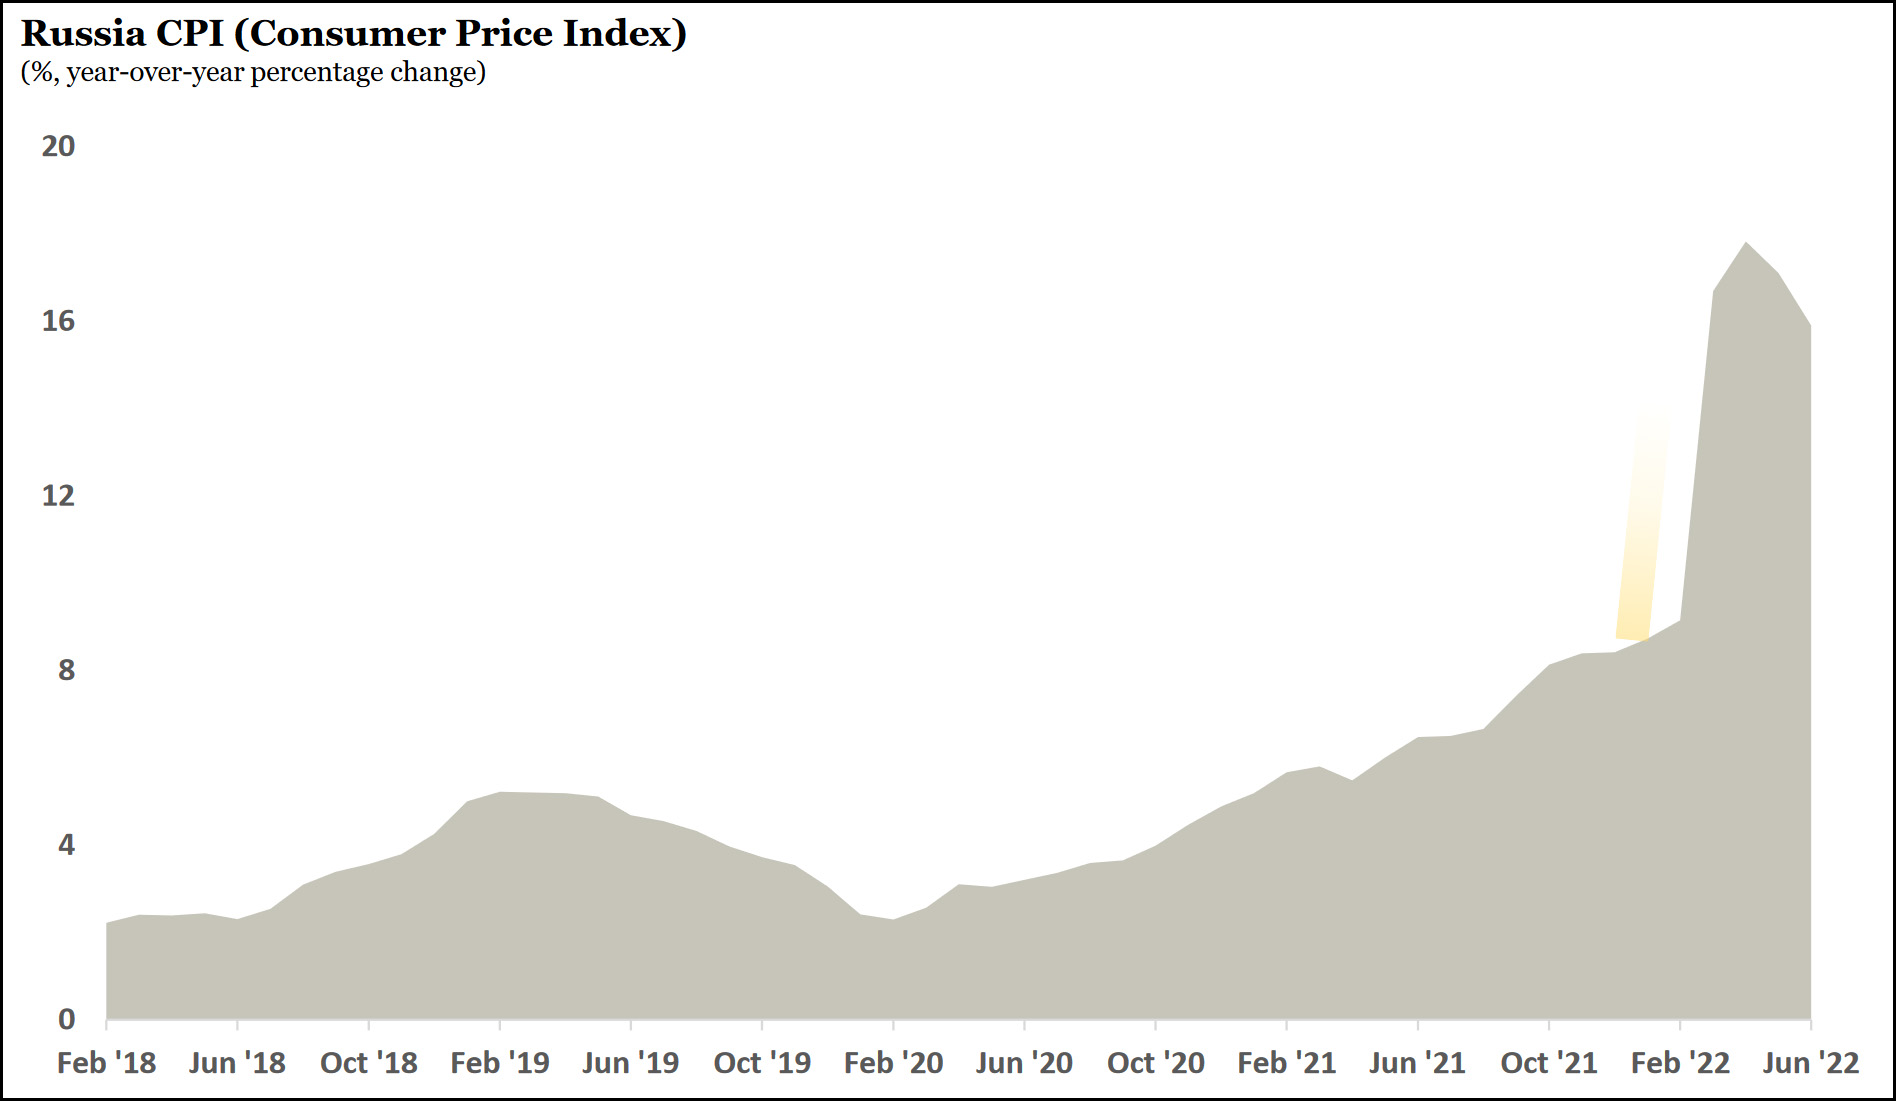
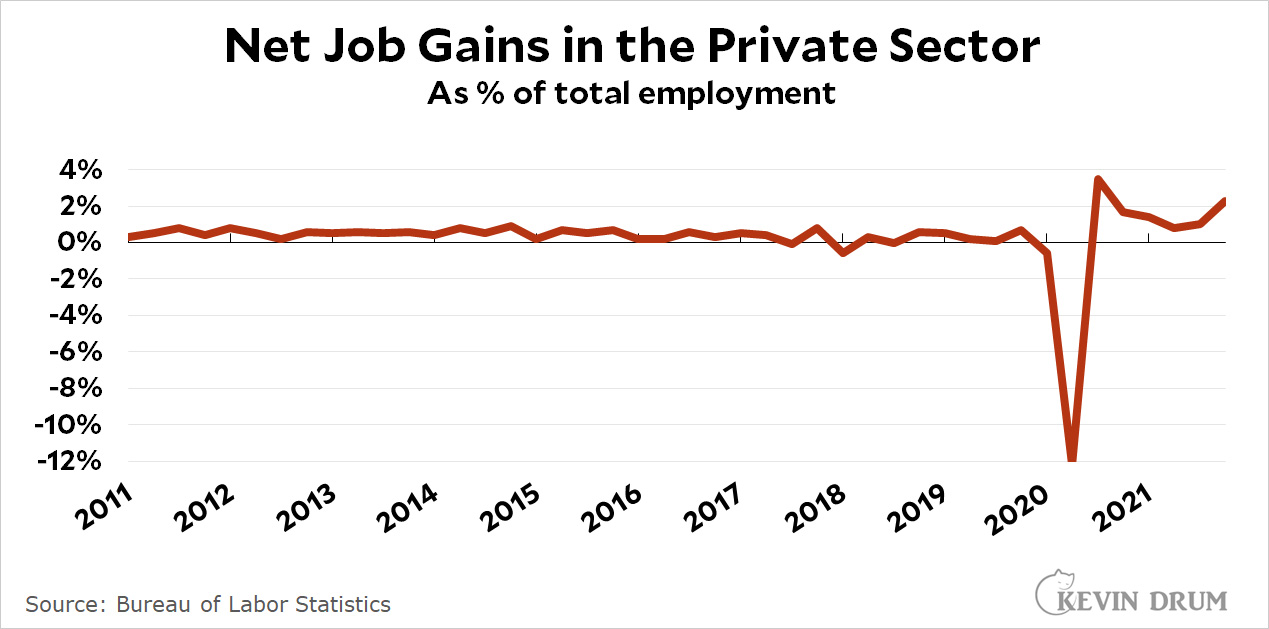
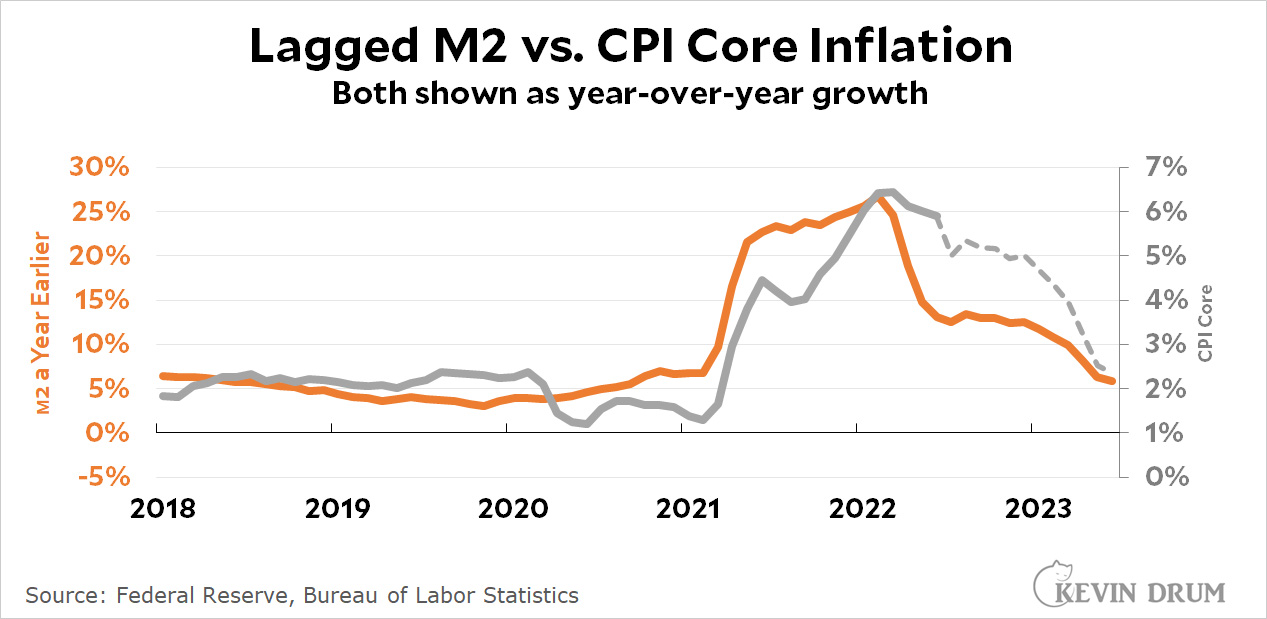
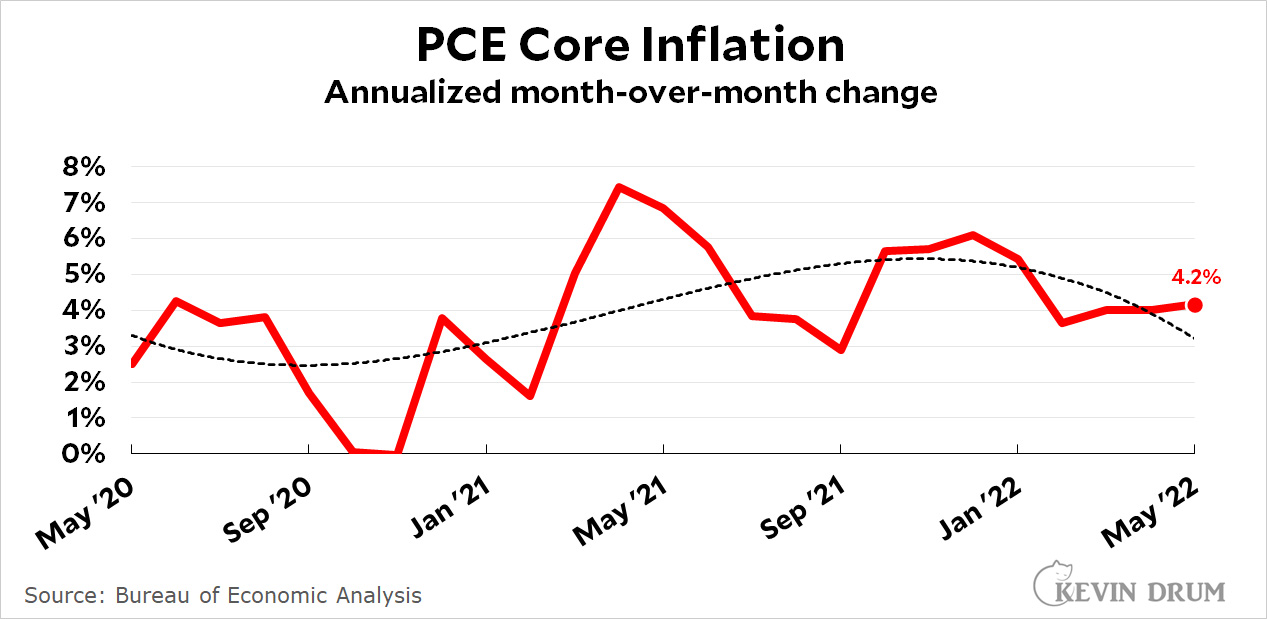
That's still a big difference, though. As for all the recession talk, it's hard to see it. Even if GDP is weak or negative, we're still talking about an economy that added more than a million jobs last quarter and maintained an unemployment rate of 3.6%. Consumer spending is flat, not down. And even core inflation is starting to ease:

On the other hand, real wages continue to decline and the stock market remained pessimistic during the entire quarter. So it's hard to say, isn't it?

In any case, what I'm more interested in isn't Thursday's GDP report but Friday's inflation report. Core PCE is allegedly the best measure of underlying inflation even though everyone ignores it, but not me. I'm genuinely curious to see where it's headed after a couple of months of refusing to make up its mind.

The BLS released its latest count of job gains and losses today. Here's the net number:

This comes to a net job loss over 2020-21 of about 2.6 million jobs. The PAYEMS series puts it at 2.9 million jobs. The employment level data shows a loss of 2.5 million jobs. So everyone is on the same page.

Keep in mind that this goes only through the end of 2021. Both the PAYEMS and the employment level figures show a whopping gain of about 3 million jobs over the past six months. This means that by the end of last month we had made back all the job losses of the pandemic and we're now even with the employment level of early 2020.

Here you go: the worst airports in the world during this, the worst summer for travel in a long time:

Not a bad showing from the US! Chicago Midway and Orlando are hardly showpiece airports, after all. However, the next set of 20 airports is a little more US-centric (JKF, Baltimore, Newark, Las Vegas, Charlotte, Denver, Miami) but doesn't include Los Angeles. I'm surprised at that considering the almost insane levels of bitching that LAX gets from locals. But it comes in at a pretty-good 91st, with only a 21% flight delay record. It must be our good weather.

Donald Luskin writes in the Wall Street Journal today that inflation is going to take care of itself and there's no need for the Fed to touch off a recession in order to rein it in. Luskin's argument is that inflation is caused by an increase in the money supply—three huge stimulus bills in this case—but the effect takes about a year to show up. If you compare CPI core inflation to the M2 money supply a year earlier, here's what you get:

That's a reasonable fit, and the dashed line shows what Luskin thinks will happen to inflation based on what's happening to the money supply right now. By the middle of next year, core CPI will be down to 2% and nobody has to lose their job to make it happen.

I really want to believe this. There are two problems: (a) Luskin is never right about anything, and (b) he's using year-over-year inflation, which just doesn't seem to right to me. Here's what his chart looks like if you compare the monthly change in inflation to the monthly change in lagged M2:

That's . . . not so good.

This is one of those times when I wish I had a better understanding of this stuff. Year-over-year inflation seems like a bad choice to me, but I don't quite know why. Maybe some really sharp monetary economist would like to chime in on this. I'd really like to believe Luskin's argument, since it fits my biases perfectly, but I'm just not sure I do.

This chart shows the growth rate of the 22 largest cities in America. Note that these are actually MSAs, Metropolitan Statistical Areas, and include most of the suburbs that surround the cities.

The only two cities that have lost population since 1970 are Cleveland and Pittsburgh. Detroit cut it close, but squeaked by with a 7% increase.