
 Brad DeLong has a new book out called Slouching Towards Utopia, an economic history of the "long 20th century" from 1870 to 2010.
Why 1870? Because Brad says that despite earlier progress stemming from the Industrial Revolution, it was only in 1870 that growth surged upward enough to affect the incomes of the common man. This created a whole new world. The causes of this surge in growth were globalization, industrial research labs, and modern corporations.
Fine. But why 2010? This is a little less clear, but Brad mostly puts it down to the failure of neoliberalism—made plain by the Great Recession—and the failure of American politics with the election of Donald Trump.
But I have a problem with this. The Industrial Revolution began in Great Britain, so that's the country it's most important to look at. Let's do that. Here is per capita GDP in Great Britain:
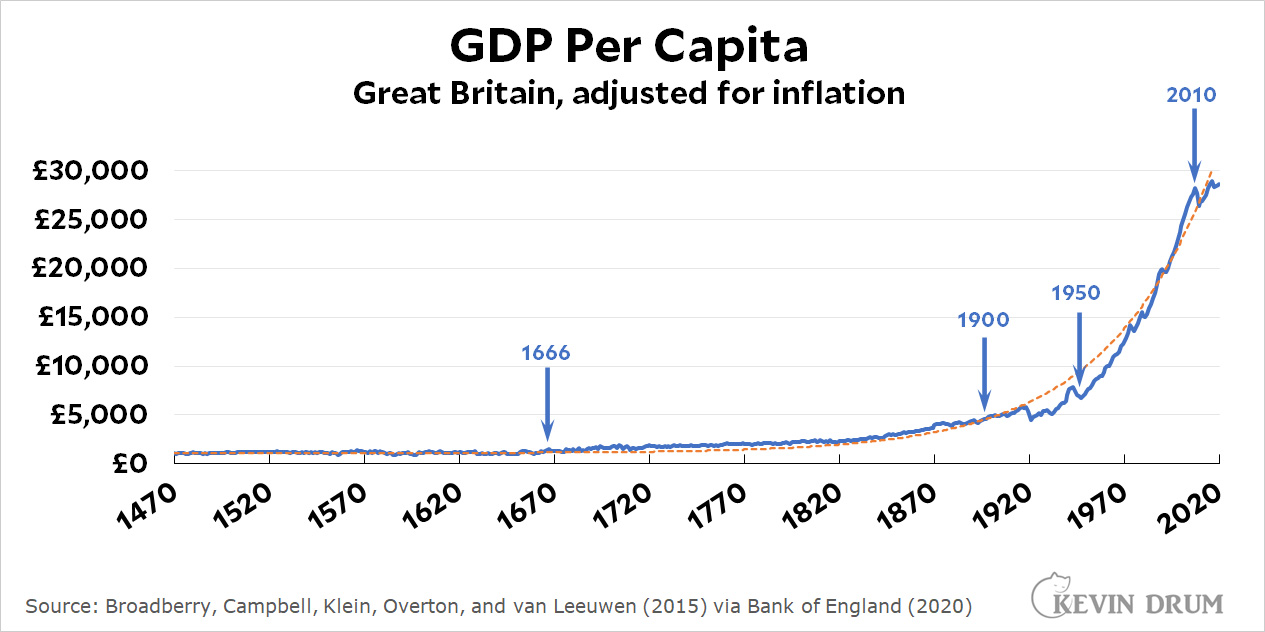 The blue line is actual GDP. The dashed orange line is a simple exponential curve that fits Britain's growth closely for the past 500 years.¹ To my mind, it means this: as long as Great Britain is on the orange curve, it's just being Great Britain. For whatever reason, this is the level of growth they produce just by doing their thing.
Now here's a closer look at the period from 1470-1900:
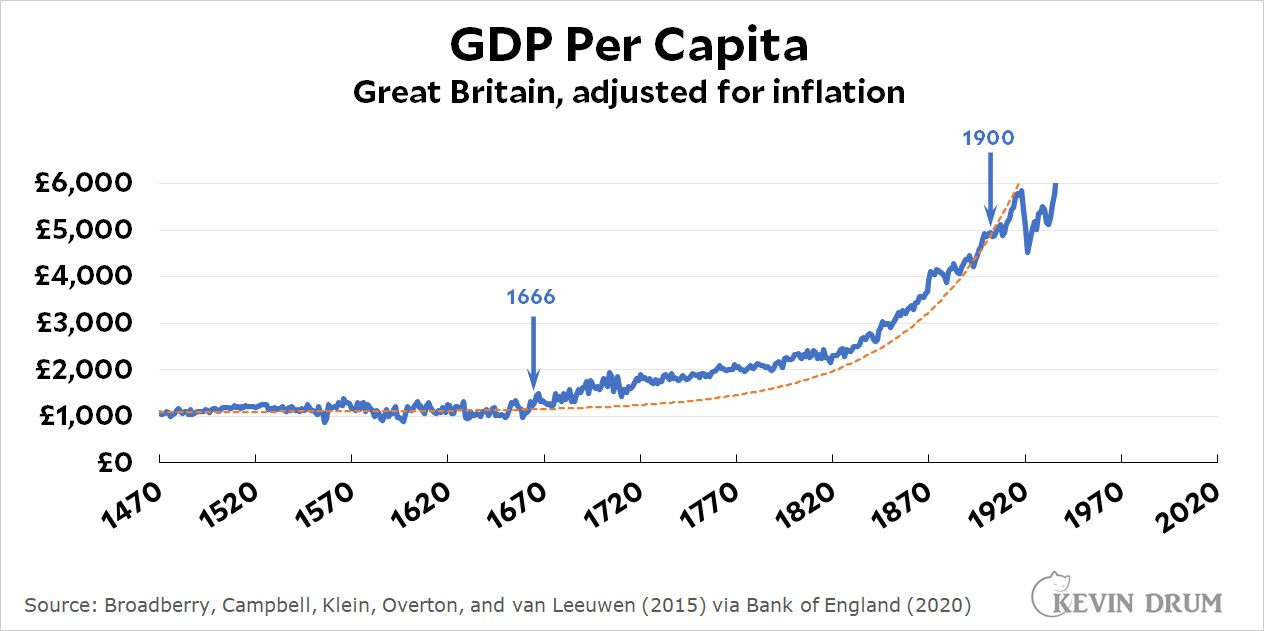 Between about 1666 and 1900, growth was higher than the orange curve. And even within that period, there are two sub-periods that stand out: 1666-1720 and 1820-1870. Then, looking at the top chart, there's another period of strong growth from about 1950-2010. Those were the real periods of super-strong growth.
Here's how I interpret this: Nothing unique happened in 1870. Great Britain was just following its normal growth path year after year—with a few smallish deviations here and there. In the 17th century this produced GDP high enough to support a growing urban craft class but did little for ordinary workers. By the late 19th century GDP finally reached a point where (a) workers started demanding a bigger share of the pie and (b) capitalists were rich enough that they could afford to meet workers' demands without any real hardship.
In any exponential growth curve there's always a knee in the curve where it suddenly seems like things have changed. This is because an absolute increase from £1,000 to £1,100 is not nearly as impressive as an increase from £4,000 to £8,000 even if they represent exactly the same level of growth. And in this case they do: the growth of per capita GDP in Great Britain was largely the same for 500 years with the exception of only a few short periods. There was nothing special about 1870, and without that the thesis of the whole book becomes rickety.
Apologies if I've bored you with this, but it's a necessary technical preface to some more substantial thoughts about the book. I'll have more about that later.
¹In case you're curious, the equation of the curve is 1.018(Year -1440) + 1100. For example, for the year 2000 this comes out to 1.018560 +1100 = £21,815 + 1100 = £22,915. Actual GDP per capita for that year was £24,402.
I read an early draft he posted. My memory is that he dug into the data, and the evidence is that the rate of productivity growh was much lower in previous centuries, pretty much worldwide. IIRC that was his claim: that the actual rate of productivity growth changed.
Now, your graph argues otherwise: that multiple r in exp(r * t) didn't change in the late 1800s. And I guess that's something one can check? I should order a copy of the book and see.
This sounds right, based on what I recall from following his blog for many years (but not so much lately now that he's shifted venues). Productivity has always been one of his go-to basic figures, maybe his most central. I don't remember much discussion of national measures like per capita gdp. And to be fair, if your primary interest is technological change and its effects, productivity may be your best statistic, showing changes that might not have been well-reflected in gdp. From an American history perspective, btw, 1870 has conventionally been tabbed as when industrial civilization really began to dominate. I don't know whether that's why Brad picked it, but it resonates for our history.
There were a lot of scientific discoveries and inventions around 1870 Maxwell's Equations: 1861. Telephone: 1876. Phonograph 1877. Electric light and generators: 1878. Radio: 1894. The world of 1880 looked very different from the world of 1865.
This nails one big difference. Before 1870 or so, it was possible to keep improving technology without a great deal of technical training often backed by advanced mathematics. This is why so many universities were founded around then. After 1870, scientific and mathematical training became central to improving productivity. They say science is organized common sense, and that organization enabled much of the progress since then.
It wasn't just in fields like chemical processing and steel making. The scientific approach, or if you prefer technocratic approach, took over in medicine and agriculture. It wasn't just Pasteur. It also changed military structures. An army needed citizen soldiers, literate and patriotic, instead of cannon fodder. That's why the tsar freed the serfs.
You didn't need post-1870 science to build early steam engines or railroads or harvesters. You could breed the best with the best in agriculture. That could only take one so far. You needed research and theoretical work to harness electromagnetic radiation, advanced alloys, organic synthesis, and control circuitry. The technology had to deal with the invisible.
Still, I've had trouble getting enthusiastic about the book. Post-1870 was not about a big jump but a long range transition. It's a useful benchmark in studying our own history, because everyday physical culture now looks a lot more like that of, let's say, 1890 than 1850. The problem is that one can say that about 1810 and 1850 with the appearance of the railroads, closed stoves, rifles, agricultural machinery and so on.
GDP per capita divided by average hours worked per worker per year, is an aggregate measure of productivity.
The anonymous author of a blog that was written during the Greek debt crisis failed to take this into account: https://meansquarederrors.blogspot.com/2015/07/greek-economy-how-terrible-was-it.html
In 2014, German workers produced 40% more value per hour worked than Greek workers: https://data.oecd.org/emp/hours-worked.htm
(Use the slider to see 2014 data.)
Damn, I stated the relationship correctly in the first sentence, then messed up in the calculation. In fact, in 2014 Germans produced almost twice as much value per hour of work as Greeks (72% more annual output, while working only 72% of the annual hours worked by Greeks.) Greece’s situation was more dire than JEC realized.
Beware of Greeks bearing nought.
I'm curious why the focus on Greek vs German productivity. From one point of view, didn't the Greek debt crisis underline the difficulties involved in yoking two such different economies into the same currency regime? As opposed to "look how unproductive those Greeks are." I seem to remember a lot of comment to the effect that initial exchange rates on entering the euro heavily favored Germany, to the point of making the southern half of the eurozone an economic colony. Even using a common currency across borders or regions, there is effectively an internal exchange rate that's related to productivity; wouldn't it tend to increasingly disfavor the less productive economy?
Like any country's, Germany's productivity patterns are complex; how exportable or emulatable are they, even assuming that German levels of invested capital per worker could be achieved in other countries?
I think we can see something like this happening with our Deep South over more than a century after the Civil War, and maybe still to some extent. TX and LA oil aside, it's been partially offset by factory relocation since about WWII, more recent overseas investment in some spots, and maybe most importantly by internal transfer payments since the Great Society. Of course we usually use other language to talk about these flows. But the formerly plantation South is still, to this day, comparatively very poor. And there's Appalachia too, with its own earmarked transfer payment systems.
Florida, Georgia, and Texas are of course probably on a par with the old industrial core region on some aggregate measures, each for different reasons (though each has pockets of poverty that are barely imaginable outside of some places in rural New England). I mean the rest of the Old South.
Yes, I think the disparity in productivity was the major cause of the north/south troubles in the Euro-zone, not the exchange rates. (My daughter was living in Germany at the time, by the way, and reported that Germans complained that prices went up when the mark was replaced.) The problem is analogous to ‘Baumol’s Disease’: wages and salaries went up quickly, to keep workers from migrating to high-wage countries, but productivity lagged. So the labor-cost content of tradable products from Southern Europe was too high; in fact, too high even to compete with imports in the domestic market.
Yes, capitalism is a artifact of the industrial revolution. Technology pays off the debt used to fund the technological expansion creating profit for capital owners and worker.
The 2000's were the end of a era. The last expansion to feature a large enough capital expansion to move GDP per capita. 1920's was really the true end. Consolidation began abruptly only covered by a massive credit bubble. Industrial bubble cities imploding and never recovering after the GD. But government bailouts and DoD driven technology have another 60 years of illusion to live off of.
So the argument is that there is nothing unique about 1870'ish if you only look at Britain (because reasons), only consider GDP (not common man income) and only if you draw a trendline that includes 1870 and the 5 decades beyond (lol)?
This refutes the idea that the income of commen people had surged at or around 1870?
The response doesn't appear to even try to address the argument. But there's charts and trendlines, so whateves.
You're well-known enough in punditry and journalism circles. Why don't you and Brad have a series of back and forth written responses?
The sequel to the infamous Chuck Klostermann/Malcolm Gladwell conversation from Grantland.
I’m usually very sympathetic to arguments like this but unfortunately this chart is badly wrong for two major reasons:
1. Fitting the curve to the entire period is very bad for exponentials unless you’re being careful about error — it’ll end up looking fine as long as you get the right hand side correct more or less regardless of how bad the fit actually is because the right part of the curve blows up so much
2. Adding the constant term makes it look like proportional growth is constant even though it isn’t.
According to the formula, percentage growth in 1440 was (1.8/1100)=0.17% not the constant 1.8% implied. Why should we think that economic growth is compounding except for the first thousand pounds of gdp?
In short, this is not good evidence that growth has been smooth and continuous back to 1440.
This is because an absolute increase from £1,000 to £1,100 is not nearly as impressive as an increase from £4,000 to £8,000 even if they represent exactly the same level of growth.
An increase from 1,000 to 1,100 (a 10% increase) is not the same level of growth as an increase from 4,000 to 8,000 (a 100% increase).
I logged in to note this, glad someone beat me to it. What was Kevin thinking here?
Because they're the same exponent, just different spots on the curve.
Kevin - dbfclark is correct. In particular, your "exponential" makes no sense and does not model any natural process of growth ("Britain doing its usual thing"), due to the weird additive term of 1100.
There is a "natural" minimum, equal to the monetary value of the food, clothing, and shelter necessary to keep a family alive. That minimum generates the 1100 number. Obviously the number itself would be different if the monetary unit was different, but a subsistence economy--a reasonable description of Great Britain in 1440--doesn't have a per capita GDP of zero.
That said, estimates of per capita GDP for 1440 should not be taken too seriously.
I've always wondered, because the worlds growth in GDP in the 19th and 20th century trends very close to the growth is use of petroleum if our current wealth is, fundamentally, linked to petroleum's easy energy extraction.
If so we should use that wealth now (as Kevin has suggested) to develop an alternative else, apart from suffocating our civilisation, we're impoverished by the need to stop burning.
That growth line up there seems to me to be held back by the Napoleonic war and later the World Wars more than anything else.
That observation works even better if you track it to coal use-- there are theories (or observations leading to theories) that density of energy usage is the key accelerant of modern-era growth. Can't cite anyone, unfortunately, the little gray cells aren't cooperating so well this morning.
There are precursors in the sense of expanding use of technologies that harness natural power sources. Windmills go back a very long way but have been geographically limited. But you can look at water-powered machinery that expanded industrial production tremendously in the US during the first half of the 19C and encouraged creation of business and financial structures that new power sources could fit into and expand. Especially steam, which allowed users to put power wherever they wanted it rather than having to find streams with enough drop or flow to drive power wheels. Maintaining (and expanding, for the developing world) our pattern of society and production based on growing energy density, while shifting to renewable power sources that probably don't offer the same exponentiation, is the climate crisis in a nutshell.
But fossil fuels, to expand your point, let density of power usage multiply or exponentiate in a totally new way. And this is where I think Kevin may be missing Brad's point of departure.
Certainly one way to look at the Industrial Revolution(s) is to view them as basically quantum leaps in humanity's ability to use energy. I pluralize them because I find splitting them into two makes sense. The first one centered around river power and coal, and the second one focused on petroleum and electricity. There's no hard dividing line between the two, but in the US and Europe, the second one got really got going after 1870: within 50 years we had cars, trucks, planes, refrigeration, motion pictures, radio, central heating, elevators, and electrical machinery of every type.
I like 1870 as that is the year my 10 year old grandfather came to California, with his family members and friends. Wish he had gotten into real estate instead of remaining a farmer.
This is interesting, but how confident can we really be in per capita GDP numbers from the 1400s through 1700s?
I was wondering that myself. Still, they jibe with numbers I have seen elsewhere, for example, the Maddison Project.
One thing to consider is that while GDP per capita is a very useful measure, it only tells you things about the outer envelope of possibility. France had its own demographic transition in the mid-18th century with a dramatic lowering of the fertility rate. The French GDP per capita was higher than the British one until the mid-19th century. Meanwhile, France stayed agricultural into the 20th century. This delayed urbanization, and let France retain an agricultural-rural outlook even as its cities developed. France never acquired the British "there is no alternative" attitude towards distributing the wealth. (18th century France also acquired a libertine reputation as the French grew increasingly open about ways to enjoy sex without pregnancy.)
The distributional aspects were different. The French Revolution in the late 18th century changed the distribution of wealth, wiped out the old aristocracy and brought in modern institutions. The British Industrial Revolution, in contrast, didn't start spreading its benefits to those less well off until late in the 19th century. (Historians usually give the year 1850 as it was in 1950 that the queen started congratulating centenarians.)
Sigh. Kevin, when will you stop following these second-raters? Delong has been thesis first, then evidence for as long as I can remember. Is he a Chicago kinda guy? Why yes, yes he is. Whyever would you ask?
DeLong isn't a Chicago kind of guy. He was pushing for fiscal stimulus when he was working for Obama. He's an economist with all that entails, but he's less dogmatic than most. If you want to smear him, find something credible.
If I'm not mistaken, his undergraduate background is in a Harvard program in which Barrington Moore (Social Origins of Dictatorship and Democracy) was a central figure. I don't recall the name of that school, something like economics and society, but it was a very ambitious broad- and interlocking-systems approach to the big socio-politico-economic questions of the post-WWII era.
So according to you, people who go with the Chicago way are incapable of advocating for fiscal stimulus. Therefore, of course, Friedman was not a Chicago sort of guy. Tell me, just how do you think I should rate your competence after this emission? I really would like to know 😉
1660 was the restoration of the Monarchy and the establishment of the Royal Society.
GDP also affected by things other than the industrial revolution, e.g. constant warfare and plagues. Once those die down, stable societies develop and can support science and technology, which leads to the industrial revolution.
Warfare and plagues aren't all bad. Warfare forces the government to spend money when it would rather practice austerity. Plagues cut the labor supply and can improve pay and working conditions. I'm not saying we need lots more warfare and plagues, just that they often have their economic benefits. For an interesting take:
"Gifts of Mars: Warfare and Europe’s Early Rise to Riches"
https://pubs.aeaweb.org/doi/pdfplus/10.1257/jep.27.4.165
Our current war and plagues are doing the opposite.
Here is another view, actually using a log scale for GDP (why doesn't Kevin do this?) which might make things clearer.
https://skeptometrics.org/BritainGDP_cap.png
On this plot, a constant rate of growth gives a straight line. The trend substantiates Kevin's points that a) there was no upward change around 1870 - on the contrary growth slowed about then; and b) highest growth rate started after WW II. Maybe the loss of the Empire wasn't such a bad thing.
As ScentOfViolets says, DeLong is not the most reliable of economic "authorities". By his own confession he has been wrong on many things.
Admitting one is wrong is surprisingly rare. When someone does, it is worth learning from them just for that reason.
That's a great chart. You can see the bends around the time of the Chartist movement in the 1830s and again around World War I. The 1830s were a time of major reform and labor violence. World War I was the end of the empire and imperial certainties.
"Here is another view, actually using a log scale for GDP ..."
Clearly a good idea.
"...why doesn't Kevin do this? .."
He's in over his head when it comes to fitting curves to data.
Could you make the same plot on a semilog-y graph? If you are trying to show exponential growth rates and changes a log axis is really useful.
Sorry for the dumb question, but isn't it relevant to ask: did 1920 feel a whole lot different from 1870?
My guess is 1920 felt much more different than 1870 (50 years earlier), than 1870 felt different from 1820 (also 50 years earlier). I'm talking about technology and especially medicine, not the abolition of slavery and other political matters.
If I understand DeLong right, from having listened to his podcast interview with the physicist Sean Carroll, DeLong's argument is that in the 20th century we figured out how to make lots of stuff -- enough for everybody, is the implication -- but we didn't do so well at figuring out how to get the stuff to everybody so everyone could live decently.
Making lots of stuff is, I guess, what is being interpreted here as Great Britain just doing its thing. But even if GB is doing its thing, there's a big social difference between the point when stuff is in short supply and there's plenty of stuff. I took that to be DeLong's point.
Well, my daily experience at my office (and right now) feels very different from my daily experience at my office in 1972, due to computers and telecommunications.
(Note that, in fact, my office experience actually began with summer jobs starting in 1974, so I am exaggerating a little.)
My guess is 1920 felt much more different than 1870 (50 years earlier), than 1870 felt different from 1820 (also 50 years earlier).
Agreed. Some major innovations that had arrived by 1870 (from fifty years previous) were railroads, steamships, telegraph and anaesthesia. Important things, but probably not quite as radical in terms of effect on daily life as what came in the next half century.
By 1920 we had telephones, electric lighting, central heating, cars, trucks, refrigeration, motion pictures, phonograph, airplanes and elevators. (Radio had been invented, but hadn't yet taken off). The modern world had arrived.
I'd say progress has slowed down though, in terms of its effect on daily life in recent years. We didn't have affordable personal computing, smartphones or streaming in 1972. Cancer treatment was a lot more primitive. But we had jets (even supersonic ones, which we no longer have for passenger travel), color TV, movies, cars, nuclear power, antibiotics, modern labor-saving appliances for the home. The quality of many things has improved, for sure. But it seems more incremental. And maybe that's because there's been no new source of energy to give us a quantum leap.
Well, what sort of 'progress' are you looking for? Because offhand, I can't think of anything spacific.
And as I like to tell my studendts, it's good to have specific examples before you argue the general case.
Our medicine is stupidly better than 1970.
Indeed. When hear certain commentors decry a lack of progress, I just take that as yet another riff on "Where's my flying car?"
No. Space colonies and lunar bases and cities under the sea are not progress. That's Disney calling from the 60's and it wants it's future branding back.
Medicine, of course and as you note, really is _stupidly_ better than what we had in 1970. If that's not an example of the rapid progress some people are bemoaning the lack thereof, I don't know what is.
Because your economic credentials are...?
There is no such thing as economic credentials.
At any rate Delong obviously pulled these dates out of his ass; everyone should know that economies grow exponentially over long periods and this is exactly what Kevin's graph shows.
Pingback: “Slouching Towards Utopia”: The actual review itself – Kevin Drum