According to the Bureau of Labor Statistics, here's the inflation rate for new cars after it's been adjusted for the overall rate of inflation:
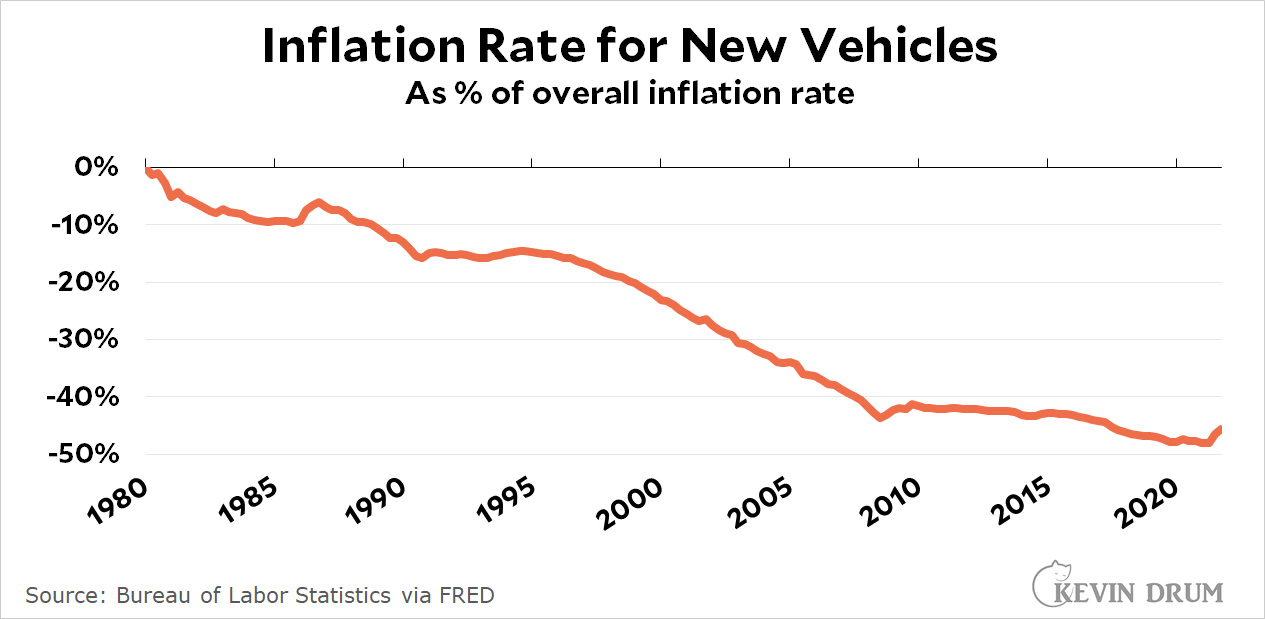 This probably looks very wrong. A Toyota Corolla cost about $5,000 back in 1980 and costs about $20,000 today. That's an increase greater than the overall rate of inflation, and it's typical of all cars. So why does the BLS say the inflation-adjusted price of cars has gone down by nearly half?
The answer is hedonic adjustments. The BLS measures not just prices, but also changes in quality. The price of that Corolla may have gone up a little faster than overall inflation, but the modern version has 17 airbags, antilock brakes, a navi-tainment system, a more reliable engine, and so forth. Essentially the BLS is saying that a Corolla costs roughly the same as it did in 1980 but you're getting twice as much car for your money.
Hedonic adjustments are applied to everything. In some cases, like loaves of bread, they don't make much difference. In others, like personal computers, they make a huge difference.
So how about health care? Everyone agrees that you have to make hedonic adjustments for health care, but the amount varies considerably depending on the treatment. An aspirin is an aspirin and requires no adjustment. Conversely, a friend of mine had a stroke a few years ago, but thanks to quick treatment with the latest technology he recovered completely by the next day. How do you measure quality improvements like this?
Tyler Cowen points to a new paper that uses a pile of cost-effectiveness data to do exactly this. It suggests that over the period 2000-17 the BLS has way underestimated quality improvements in health care and therefore way overestimated health care inflation. The authors illustrate this with a price index that's a little obscure and hard to replicate, so instead I'm going to roughly mimic their results using the ordinary PCE price index:
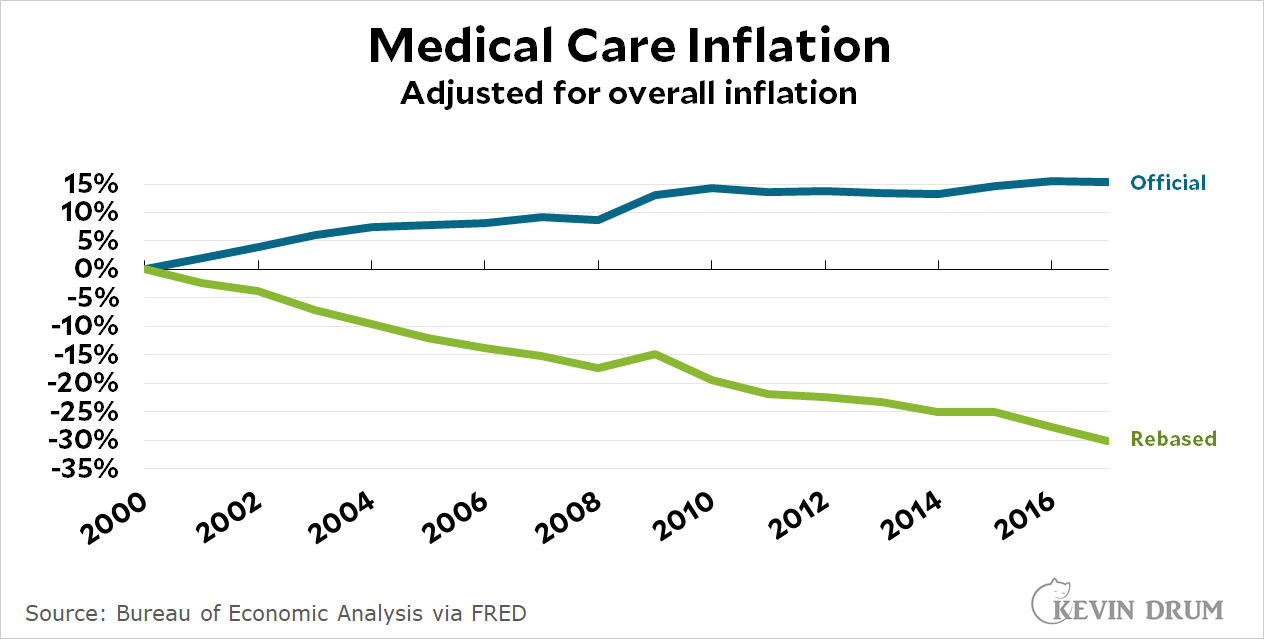 Very roughly speaking, official figures suggest that annual health care inflation has averaged about 0.8% above the overall inflation rate. But if you recalculate that number using the bias adjustment in the paper, prices have gone down by about 2% per year compared to overall inflation.
For the record, the numbers in the paper, which are based on a sectoral output price index and a complicated rebiasing formula, are 0.53% and -1.33%. However, there are a couple of reasons not to take the precise numbers too seriously:
- They are based on a database of quality improvements for individual procedures, along with an estimate of how widely these procedures are used and how much their increased efficiency has diffused throughout the health care industry. This obviously has a huge scope for error.
- The quality improvements are converted into QALYs, or the number of additional years of life that patients get from better procedures. However, the authors say their results are highly sensitive to estimates of the value of a single year of life. They use $100,000, but if instead they used $50,000 it would eliminate their main result.
So that's that. The authors conclude that the quality of health care has increased much more than official estimates, but even with painstaking effort this is always going to be a very difficult measurement to make. Even small changes in model estimates can balloon into large differences over the course of a couple of decades.
Still, it's an intriguing study. If the average treatment for a heart attack cost $100,000 in the year 2000 and provided five extra years of life, how does that compare to a modern treatment that costs $115,000 (adjusted for inflation) but provides seven years of additional life? The cost of the treatment is 15% more, but the cost per QALY has gone down 18%. So what's the right inflation measurement for that?

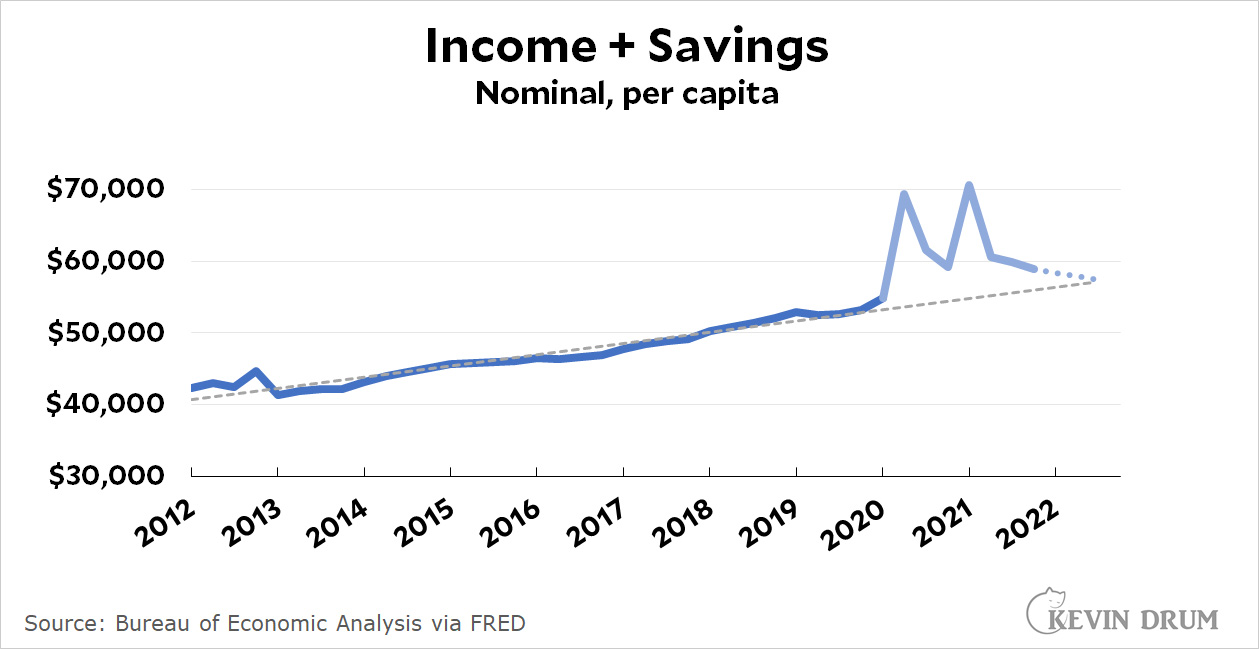 The spikes coincide with the two big COVID rescue bills, which filled up household savings accounts. But as you can see, that money has largely been spent and there's no more on the way. If we follow the current trend, we're likely to revert to our pre-pandemic trendline in a few more months.
 Finally, on the wage side, I'm a little puzzled about what the problem is supposed to be:
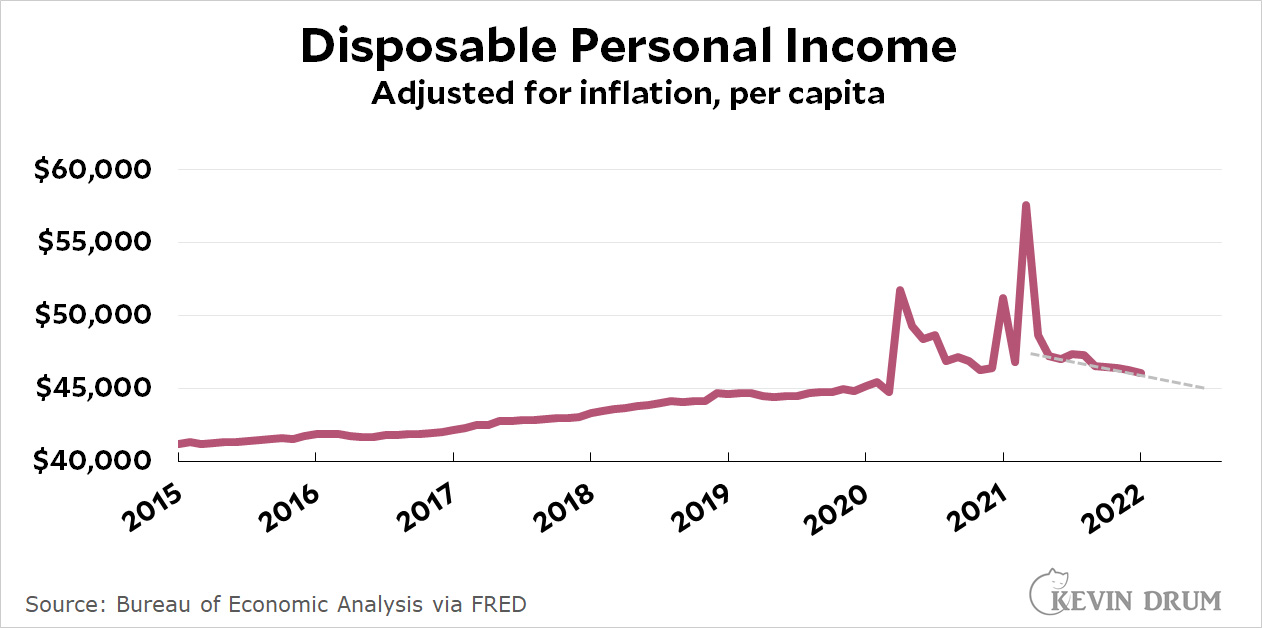 A '70s-style wage-price spiral happens when wage demands outpace inflation, which then forces companies to raise their prices above the inflation rate, rinse and repeat. But that's not what's happening today. Wage increases have been below the inflation rate for nearly a year.