Skip to content

I've seen a number of people express astonishment about how we decide when recessions start. It turns out that the answer has nothing to do with two consecutive quarters of GDP decline and it never has. Rather, a group of gnomes who work for the National Bureau of Economic Research stir a bunch of stuff into a pot and eventually pick a date.

This raises a question: What the hell is going on? Who decided on this squirrely procedure? And why does this NBER outfit get to do it?

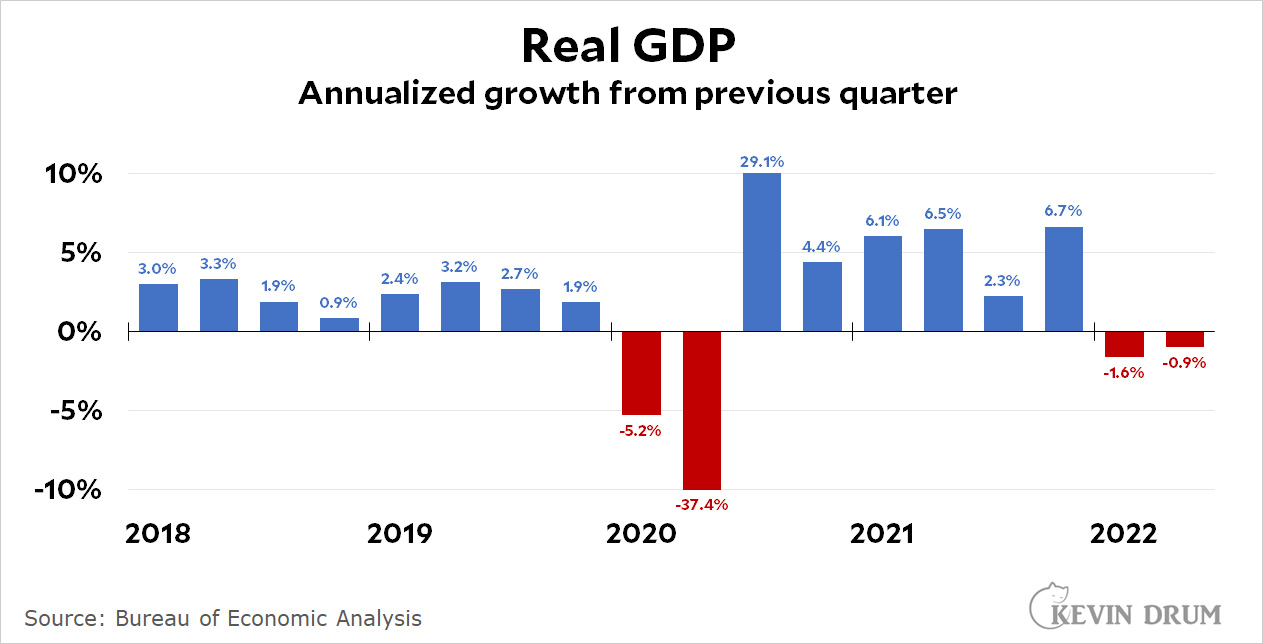
That's an interesting story, and I'll get to it shortly. First, though, here's a chart of the US economy over the past 70 years:

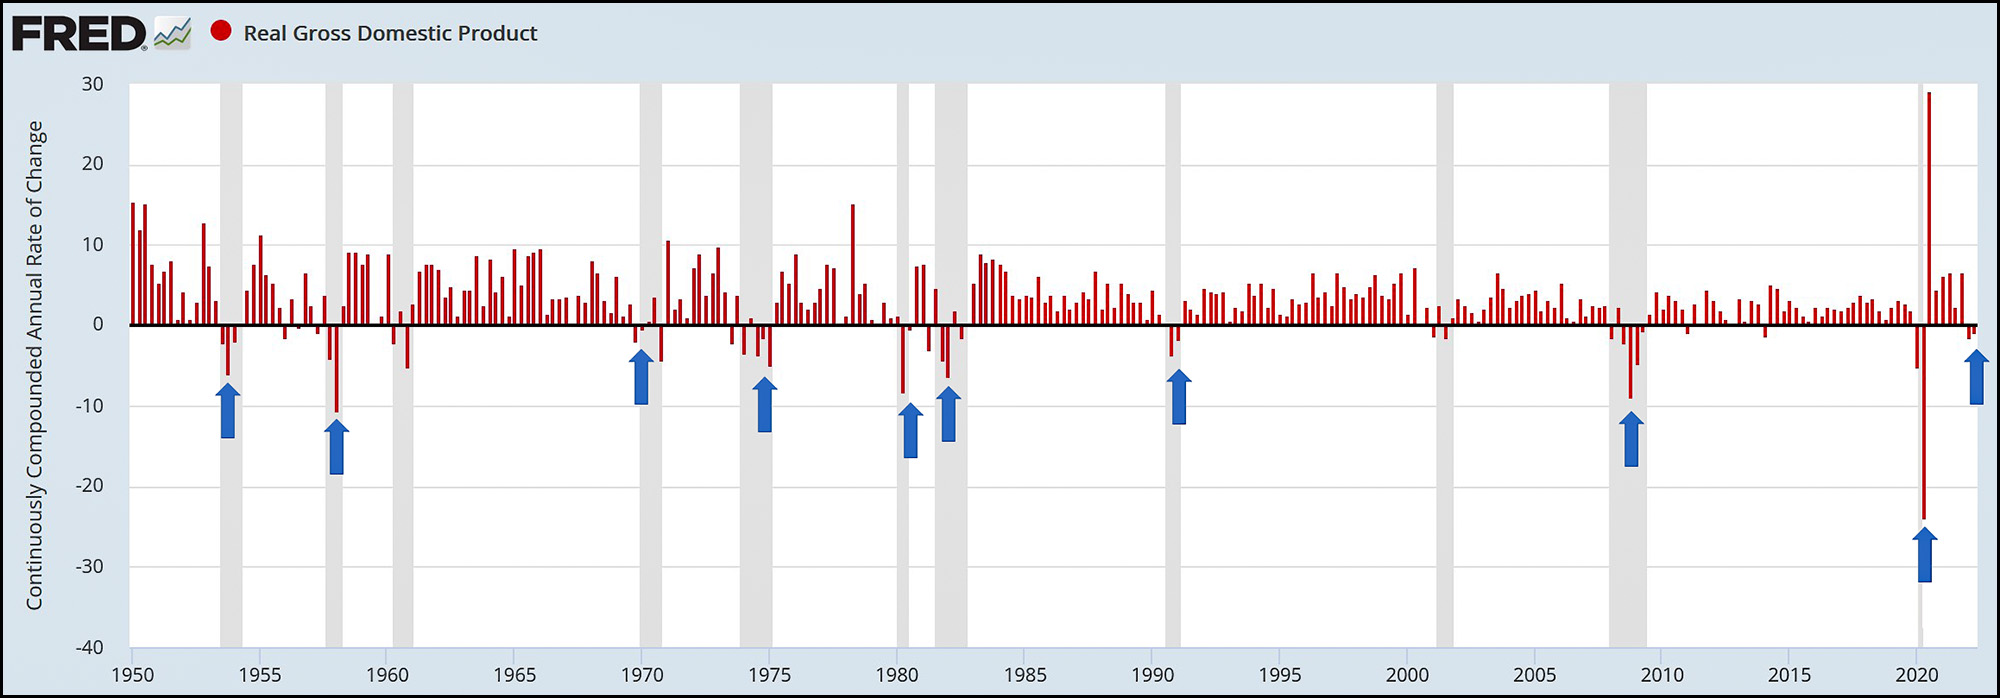
The blue arrows indicate all ten times that we've had two consecutive quarters of GDP decline. In every single one of those cases, NBER eventually declared a recession. This makes it highly likely that NBER will do the same this time.

Or does it? One thing you'll also notice is that our current GDP decline is the smallest of the ten. So . . . maybe it's not a recession? How do we know? This is where our story starts.

Back in the early 20th century an economist named Wesley Clair Mitchell decided to devote his life to the empirical study of business cycles. Mitchell believed that modern industrial economies ran in irregular cycles of expansion and contraction, and these cycles affected nearly all economic activity. This was an important insight, and of course he turned out to be right—not just about the existence of the business cycle, but its importance.

Mitchell built on this insight by trying to precisely define and date business cycles. To do this he set out to gather time series of anything he could. He didn't have the BLS or the BEA or FRED, so he had to make do with whatever he was able to come up with at the time: pig iron production, bank clearing volumes, freight receipts, unemployment numbers, anecdotal evidence from business barons, dodgy business activity indexes, and anything else that might be a good indicator of economic health. Two things resulted from this: (a) a big ol' book on business cycles and (b) the creation of NBER.

Mitchell was a founder of NBER in 1920 (see Christina Romer's paper here, video version here) and its initial director of research. In that position he continued his search for data and turned NBER into a bustling hub of research into business cycles. In 1929 he published, almost as an aside, his first comprehensive dating of business cycles from 1855 to 1921.

Now, pig iron and freight receipts are all very fine, but why didn't Mitchell use GDP as one of his measures of the business cycle? The answer is simple: Simon Kuznetz, a student of Mitchell's and an economist working at NBER, hadn't invented it yet. It wouldn't be until after World War II that GDP was refined into a useful measure of economic activity.

So this is the story: business cycle dating was basically invented at NBER in the 1920s, and it didn't rely on GDP because GDP didn't exist back then. However, Mitchell was a pragmatist, and he was willing to adopt new economic measures if they turned out to be reliably correlated with other measures of business activity. If we now whisk ourselves to the present day, we'll find that after decades of changes NBER currently uses the following six metrics to date business cycles:

  • Real personal income less transfers (PILT)
  • Nonfarm payroll employment
  • Real personal consumption expenditures
  • Manufacturing (wholesale) and trade (retail) sales adjusted for price changes
  • Employment as measured by the household survey
  • Industrial production

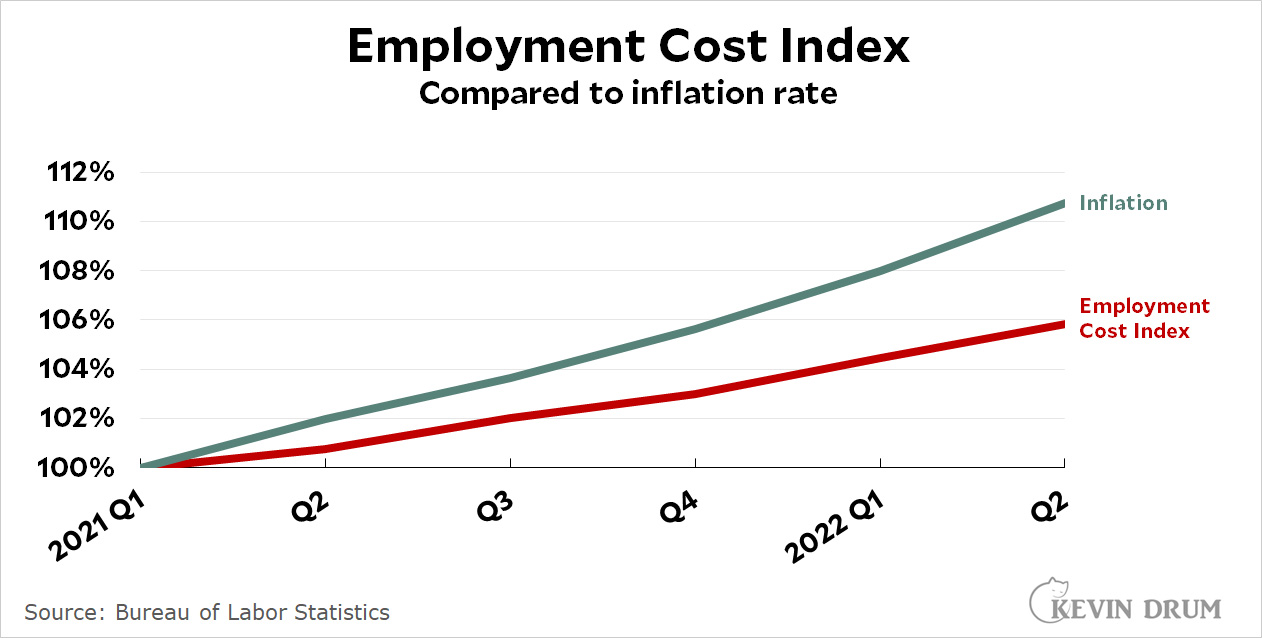
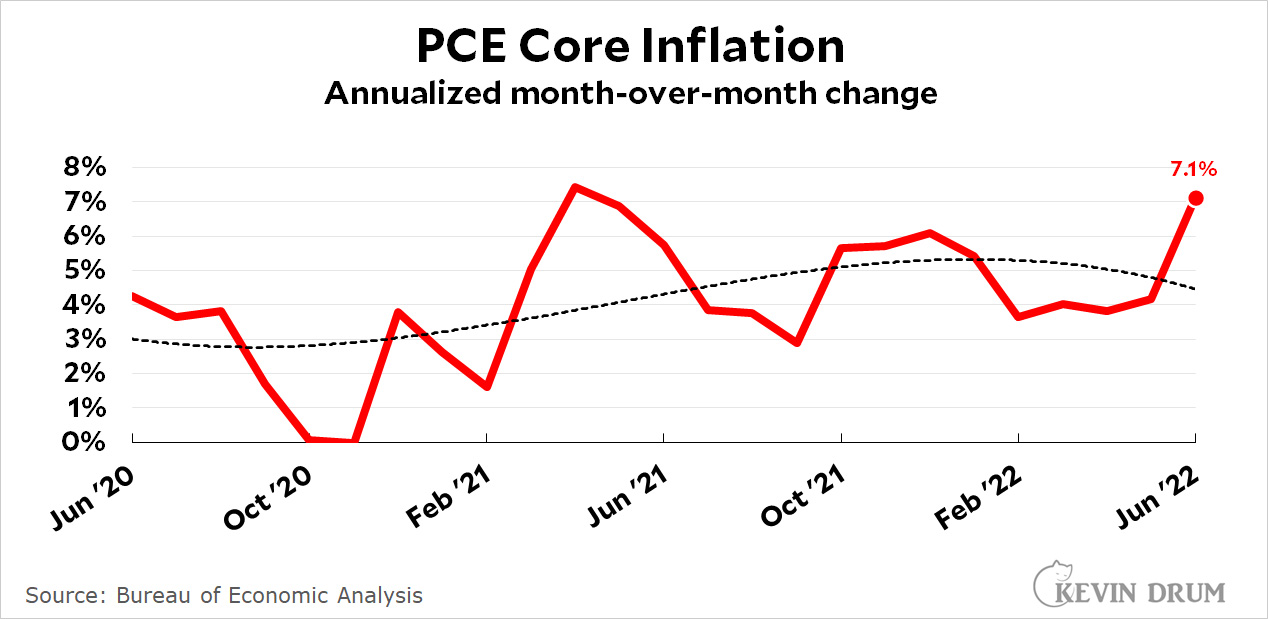
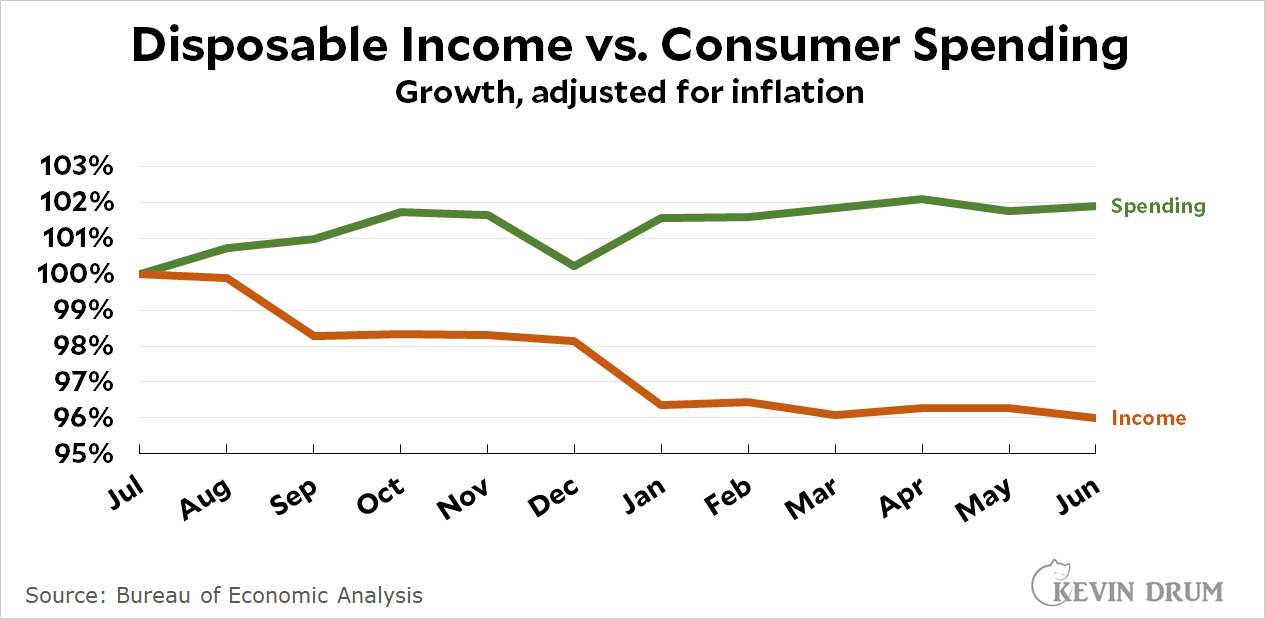
Here's what those six things look like over the past couple of years:

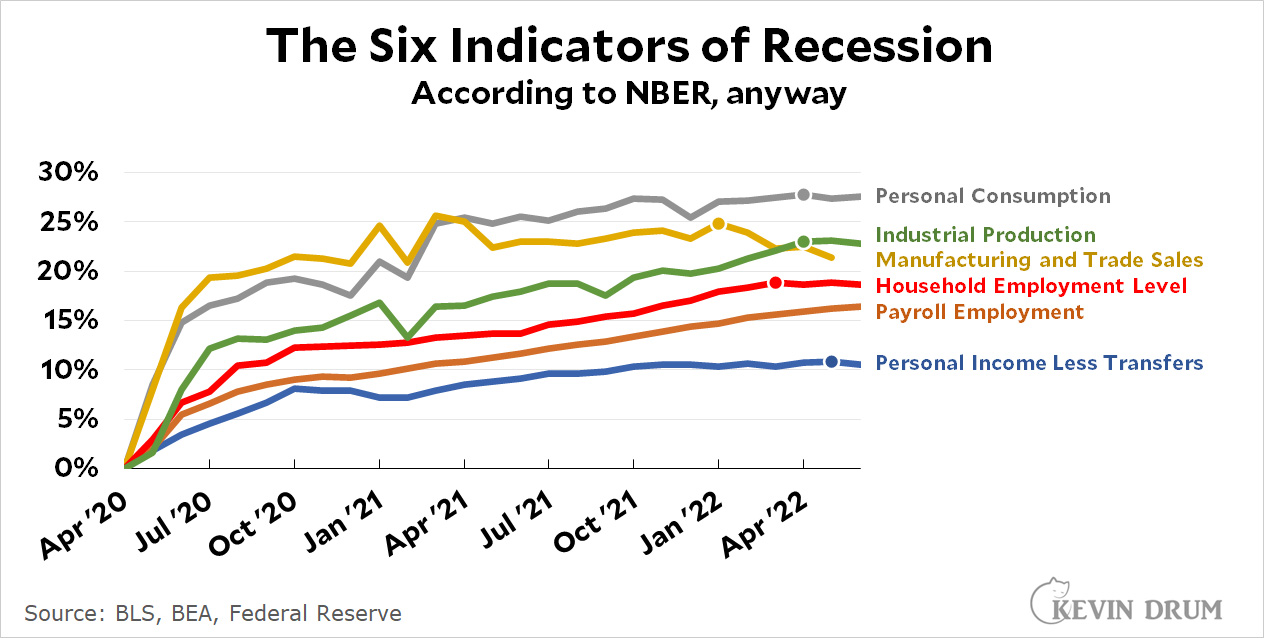
I've placed a marker on each line indicating its recent maximum. Those might also represent the peak of the current business cycle. But it's hard to say, isn't it? Personal consumption is basically flat. Manufacturing and trade sales are on a clear downslope, while industrial production and personal income are just slightly down. Will they tick back upward or keep going down? And payroll employment hasn't peaked at all. It's still heading steadily upward.¹

There's no reason you can't play this game at home. If you average out the markers, you'd probably figure that the economy peaked and then started to slow around April of this year. Are you willing to make that call? Or . . . maybe it doesn't look entirely clear?

This is why NBER often waits a while to announce when a recession has started. They don't care much about headlines in newspapers or even in recessions per se. This is just a technical exercise of dating business cycles.

And why do we let NBER do this? Because they got there first and developed a solid reputation for doing a good job. I suppose, also, that no one else really wanted to do it.

Nickel summary:

NBER decides on recession dating because they started doing it a long time ago and no one ever tried to take the job away from them.

They've never used GDP as one of their indicators of economic activity. One of the reasons, oddly enough, is that their dating is done by month and GDP is only produced every quarter.²

They currently use the basket of metrics listed above to decide when the economy has reached a peak (end of expansion and start of recession) and a trough (end of recession and start of next expansion).

It takes them a while to announce recession dates because they want to be sure. And the only way to be sure is to have plenty of hindsight to work with.

¹I should add that there's no formula here. The folks who sit on the dating committee are allowed to stare at the numbers until their eyes hurt and then make their own judgments based on whatever heuristic seems best to them.

²This is going to sound crazy, but NBER also dates turning points by quarter. For that, they add real GDP as one of their measures. Or more accurately, an average of GDP and GDI.

This chart comes from Scott Hechinger, who got it from Bloomberg:

The rate of shootings has actually gone down a bit over the past year, but when Eric Adams took over as mayor (in January) media coverage of shootings suddenly skyrocketed. So now everyone is scared about their safety even though there's little reason to be.

But wait. "Little reason" doesn't mean no reason. According to the NYPD, murder is down but every single other category of major crime is skyrocketing:

The NYPD reports that incidents of major crime are up an incredible 37% through July of this year. The chart above is extrapolated from that.

But wait. (Yes, again.) This is wtf territory. In the past two decades, the city's biggest annual increases in major crimes were 4.2% in 2012 and 7.5% last year. What's more, the increase in minor crimes so far this year is only 13%. That's high but not unbelievable. Conversely, an increase of 37% is beyond eye popping. It's frankly hard to believe.

But if it's true, then (a) the media should be screaming about it, (b) people should be scared, and (c) we should be dispassionately trying to figure out what's going on.

Ha ha. Just kidding. What's really happening, as you'd expect, is the exact opposite of dispassionate. Politically, the crime surge is mostly being used as a crude cudgel in the fight over a bail reform law passed a couple of years ago. As near as I can tell, though, there's little evidence that bail reform has had much effect on crime in New York City:

This chart shows the number of people who committed any kind of new offense while on release awaiting trial. Among those who were released without bail, the number of re-offenses averaged about 1,900 per month in 2019 and went down to 1,700 in 2021-22. If you look only at felonies you get about the same rate of re-offending before and after bail reform (roughly 500 per month).

In other words, bail reform doesn't appear to be the problem. It certainly isn't the kind of thing that leads to a 37% increase in serious crime.

So what's going on in New York City? I don't know, but a farfetched increase in crime at precisely the time a new mayor enters office is damn fishy. And that's probably being unfair to fish.

I started laughing about halfway through today's Washington Post story about the deletion of Secret Service text messages from the days surrounding the 1/6 insurrection. It took that long to fully appreciate the thesaurus woo of reporters Drew Harwell, Will Oremus and Joseph Menn. Here's a list of the words and phrases they use to describe what happened:

stunned . . . bungled . . . incompetence . . . raised suspicions . . . high degree of skepticism . . . “highly unusual” . . . “ludicrous” . . . “failure of management” . . . just sounds crazy . . . baffling . . . organizational failure . . . failure of policy and governance . . . “a comedy of errors” . . . strange . . . “does sound fishy” . . . an odd choice . . . “more questions than answers”

For the record, it was around the word "baffling" that I finally realized just how many synonyms for "crazy and unbelievable" the writers had been forced to come up with.

Of course, none of them are correct. The proper phrase is "the mass deletion was obviously done deliberately to hide their tracks," but I suppose the Washington Post can't just come out and say that, can they?

POSTSCRIPT: Why am I so sure it was deliberate? Because of this fact pattern:

  1. All the texts from the two weeks before and after 1/6 were deleted.
  2. Prior to its "reset," the Secret Service's IT department didn't do a systemwide backup of text messages. They asked individual agents to do it themselves. This is something that goes way beyond incompetence. There's not an IT manager on the planet who would do this unless they literally didn't care if it got done and were only checking a box for legal reasons.
  3. There's no sign that anyone on the IT staff ever did anything more than send an email with backup instructions. They didn't call agents to walk them through it. They didn't tell agents to email them when they had done the backup. They kept no records of who had confirmed their backups and who hadn't.
  4. Apparently not one single agent actually followed instructions to perform a backup. Not one.
  5. Even after 1/6—which should have shook them up a bit—and even after Congress had explicitly asked the Secret Service to preserve information about 1/6, they blithely went ahead with the reset despite the certain knowledge that it would result in the loss of data.

I suppose I could still be wrong about this. I'm not, though.

We all have our favorites, and Obamacare is one of mine. So I was very happy to see that, against all odds, the latest version of the Democratic spending bill¹ includes a three-year extension of the expanded ACA subsidies originally introduced last year in the American Rescue Plan. These subsidies ensure that no one has to pay more than 8.5% of their income for health insurance.

What's always gotten me about this is how cheap it is. Right now it's penciled in at $64 billion over three years. That's $21 billion per year. In other words, peanuts. We spend that much every year on WD-40 for our aircraft carrier fleet.²

The bill also includes a couple of other small but favorite things. First, it will place limits on the carried interest loophole, which allows hedge fund managers to make billions of dollars in personal earnings at very low tax rates. I'd love to see the CIL eliminated completely—especially since everyone claims to hate it—but I guess baby steps are better than nothing.

Second, it sets up a program to automatically file taxes for people with simple tax returns. This is a no-brainer of a program, but it's been stopped in its tracks for years by TurboTax and the other tax prep folks. It's long past time we told them to pound sand.

The bill also allows Medicare to negotiate prices for ten drugs, which is faintly absurd. But I guess it's a place to start.

And finally it has a huge boatload of money for climate change and a bunch of tax increases to pay for all this. But that part you probably already know about.

¹Officially called the Inflation Reduction Act, which is ridiculous. The acronym for this is IRA, which is even more ridiculous since it can be so easily confused with both the Irish paramilitary group and the retirement accounts of the same name. But I guess everything has to be related to inflation these days.

²Not really.

UPDATE: I originally said that the carried interest loophole had been eliminated in this bill. That's not true. It's been made less generous, but it wasn't killed off completely.

For chrissake:

Neither worker pay nor benefits grew at anything close to a record pace last quarter unless you insist on never adjusting anything for inflation. Here's what total compensation for workers looks like over the past two years:

Since the beginning of 2021, ECI has risen 6% while inflation has gone up 11%. Employers are paying their workers less, and compensation certainly hasn't been keeping pressure on inflation. Just the opposite.

For the record, real ECI was down a whopping 4.6% last quarter on an annualized basis. Keep this in mind if you're wondering how corporate earnings can be so strong when we're supposedly heading into a recession.

Uh oh:

As usual, monthly changes are volatile and no single month should be taken as definitive of long-term inflation trends. Still, this isn't good news. I'm not sure what suddenly happened in June, but the core inflation rate nearly doubled compared to May. In addition, disposable income dropped 3.6% on an annualized basis, while consumer spending increased 1.4%. This keeps happening:

Needless to say, this can't keep up forever.

I'm not a big fan of formal French gardens, but if you're going to see one I suppose Versailles is the pinnacle of the art. When we were there the famous fountains weren't running because they only operate them on weekends. I don't get that. Sure, back in the day they were an engineering marvel, but now they're just ordinary fountains operated by ordinary electric pumps. Why not run them all the time?

May 25, 2022— Versailles, France

It looks like the Atlanta Fed's forecasting prowess was pretty good for second quarter GDP:

Real GDP declined 0.9% on an annualized basis, so we now have two consecutive quarters of contraction. On the bright side, real GDP was up 1.6% compared to a year earlier.

Down in the details, none of this can be blamed on the brave American consumer, who increased spending by 1% in the second quarter. At the same time, corporations cut their investment level by 13.5%, mostly due to reduced construction, and government consumption was down 1.9%, the third consecutive quarter of declining government spending.

And now let the battle begin: Are we in a recession? I still vote no.

So how is Russia doing these days? Tyler Cowen points us to a paper from the Yale School of Management that says the Russian economy is in terrible shape:

Our team of experts, using private Russian language and unconventional data sources including high frequency consumer data, cross-channel checks, releases from Russia’s international trade partners, and data mining of complex shipping data, have released one of the first comprehensive economic analyses measuring Russian current economic activity five months into the invasion, and assessing Russia’s economic outlook.

From our analysis, it becomes clear: business retreats and sanctions are catastrophically crippling the Russian economy.

Among many, many other things, the authors say that consumer spending is down about 20%; auto sales have collapsed; industrial production has been cut back across the board thanks to sanctions that prevent the import of crucial components; inflation is running at nearly 20%; and Russian oil is selling at a huge discount. Naturally you'd like to see all this in charts. Here you go: